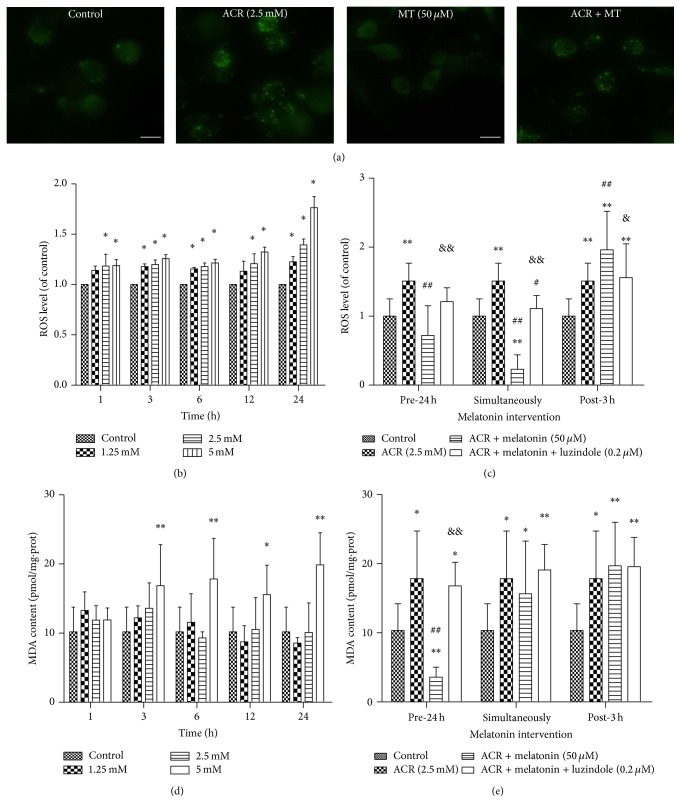
Figure 4.
Effects of MT on ROS and MDA generations induced by ACR in PC12 cells. Intracellular ROS was evaluated by DCFH-DA detection. Fluorescent photographs were shown after exposure to ACR with or without MT cotreatment for 24 h (scale bar: 25 μm) (a). In addition, ROS (b) and MDA (d) productions induced by treatment with ACR (1.25, 2.5, and 5 mM) alone for 1, 3, 6, 12, and 24 h. Moreover, MT (50 μM) and luzindole (0.2 μM) interventions at different times: 24 h pretreatment, simultaneously, and 3 h posttreatment with ACR (2.5 mM) for 6 h were designed ((c) and (e)). The results are expressed as the mean ± SD (n = 8). ∗ P < 0.05, ∗∗ P < 0.01 versus the vehicle control group. # P < 0.05, ## P < 0.01 versus the ACR treatment group, & P < 0.05, && P < 0.01 versus the ACR + MT cotreatment group.

