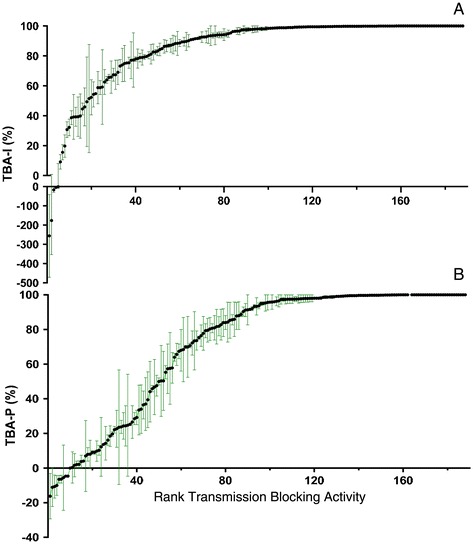
Figure 3.

Transmission blocking activity based on infection intensity of 188 unknown sera. Samples are arranged in rank order of TBA. Each point indicates the arithmetic mean percent TBA of two independent assays and error bars represent the range of percent TBA. (A) TBA-I. Five sera increased infection intensity and 125 sera demonstrated >90% TBA-I. There was higher variability in TBA-I between duplicate assays in samples with <70% reduction in infection intensity. (B) TBA-P. Nine sera increased infection prevalence and 101 sera demonstrated >90% TBA-P. High variability in TBA-P between duplicate assays was observed only in sera with <80% reduction in prevalence.
