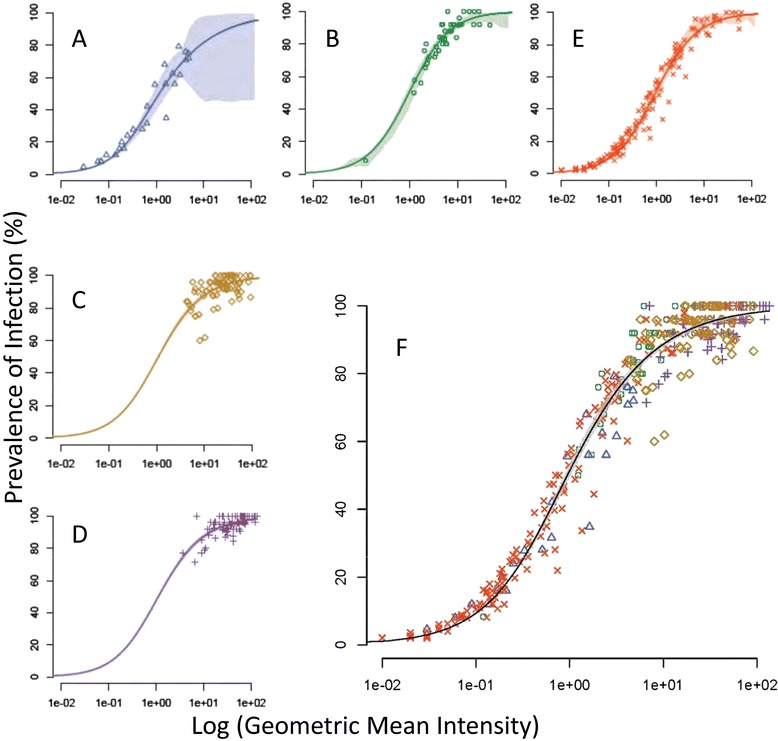
Figure 4.

Relationship between intensity and prevalence of P. falciparum oocysts in mosquitoes fed control monoclonal antibodies and test sera. (A) MRA38 monoclonal antibody (B) MRA39 monoclonal antibody; (C, D) Negative control sera for (A) and (B) respectively; (E) Unknown experimental sera; (F) All data pooled to show consistency of relationship between the infection characteristics in all experiments. Shaded area is 95% confidence interval round the curve for the pooled data.
