
Fig. 2.
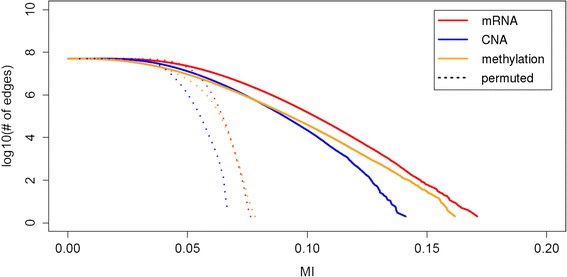
Empirical distribution of mutual information values. We show the distribution of mutual information values computed for every pair of genes in each profile of mRNA expression (red), CNA (blue) and methylation (yellow). The solid lines correspond to the values with respect to the original clinical outcome labels, and the dotted lines are with respect to the permuted labels averaged over 30 permutations