Fig. 4.

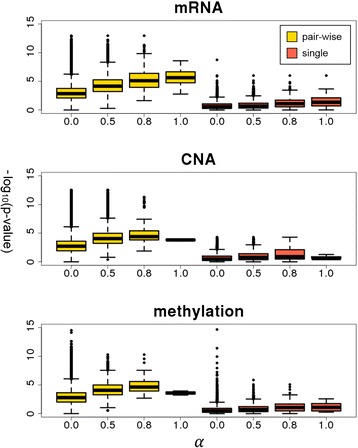
Boxplots for p-values from survival analysis. The distribution of p-values from the survival analysis for the extracted gene pairs obtained from different significance levels of α is shown as a boxplot

Boxplots for p-values from survival analysis. The distribution of p-values from the survival analysis for the extracted gene pairs obtained from different significance levels of α is shown as a boxplot