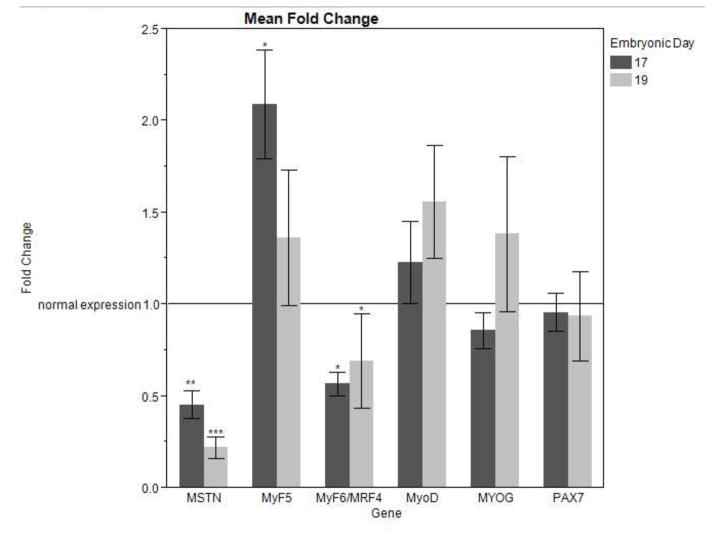
Figure 2.
mRNA expression of MSTN and MRFs in ED17 and ED19 collected pectoralis major samples after 48 hours of induced hyperammonemia (Four injections of [50 mmol/kg] ammonium acetate) in experimental samples. mRNA expression was measured by quantitative real-time PCR and each sample was normalized using β-actin as an internal control. Bars represent the mean fold change ± SE. *** indicates significance of (P < 0.001); ** indicates significance of (P < 0.01); * indicates significance of (P < 0.05).

