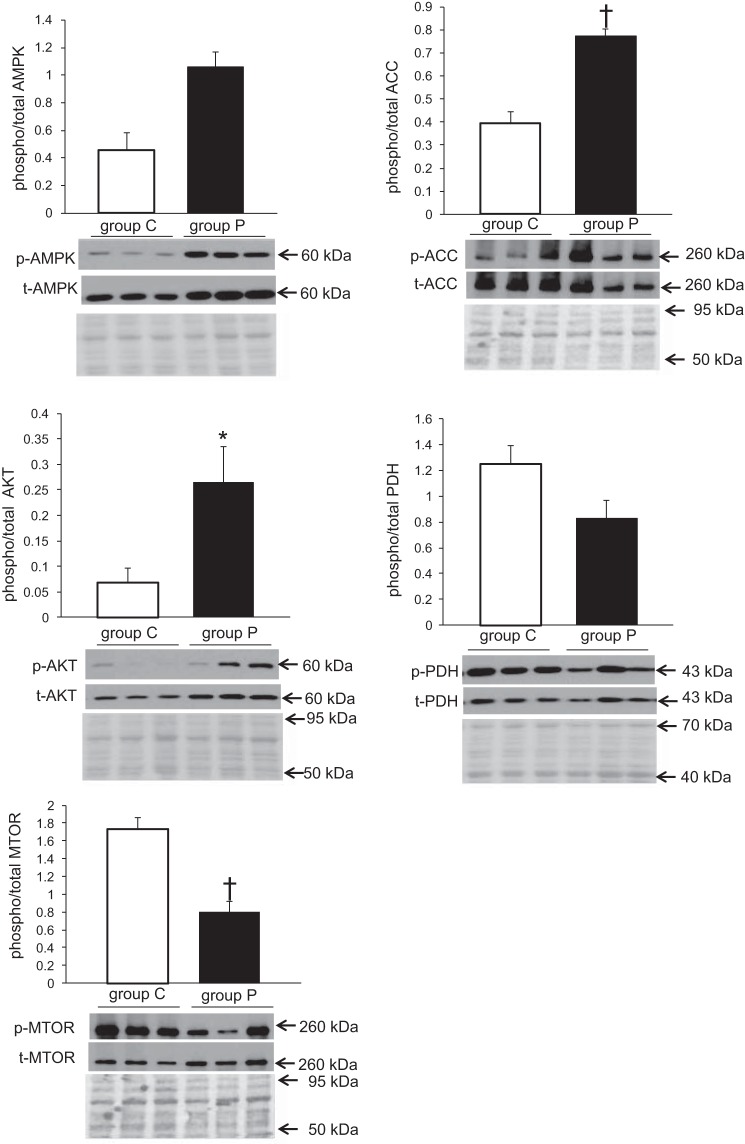
Fig. 10.
Representative blots for expression profiles of proteins involved in regulation of nutrient or energy sensing. Phosphorylation levels normalized to total levels were assessed for AMPK, ACC, AKT, PDH, and mTOR. Total protein stains are shown below immunoblots to assess loading quantity. Values are means ± SE; n = 6 per group. All experiments were performed in duplicate, representative blot shown. *P < 0.05 vs. group C, †P < 0.01 vs. group C.

