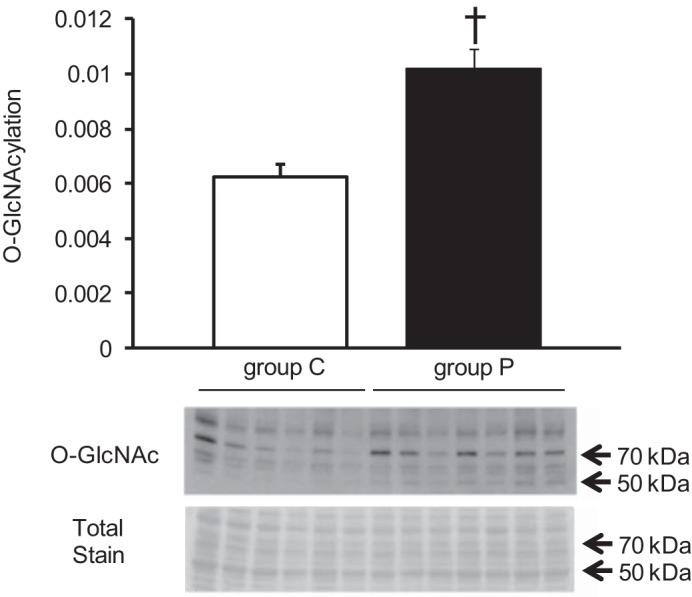
Fig. 11.

Representative immunoblots with densitometric analyses for O-GlcNAc proteins. O-GlcNAc proteins were normalized to total protein stain. Values are means ± SE; n = 3 per group. †P < 0.01 vs. group C.

Representative immunoblots with densitometric analyses for O-GlcNAc proteins. O-GlcNAc proteins were normalized to total protein stain. Values are means ± SE; n = 3 per group. †P < 0.01 vs. group C.