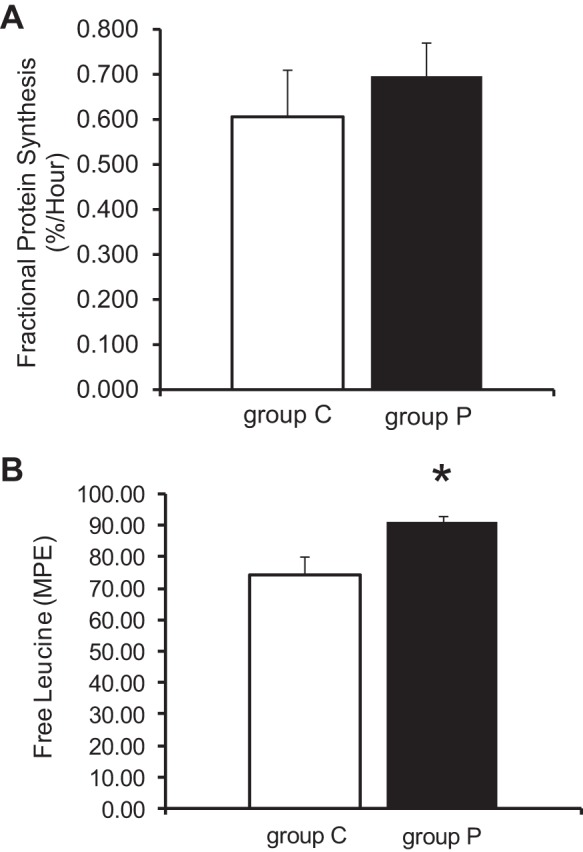
Fig. 8.

Intracellular free leucine and global fractional protein synthesis rates (FSRs) by GC-MS. A: FSRs were not significant different among the 2 groups. B: intracellular free leucine showed a significant increase in group P vs. group C. Values are means ± SE; n = 6 per group. *P < 0.05 vs. group C. MPE, molar percent enrichment.
