Fig. 1.
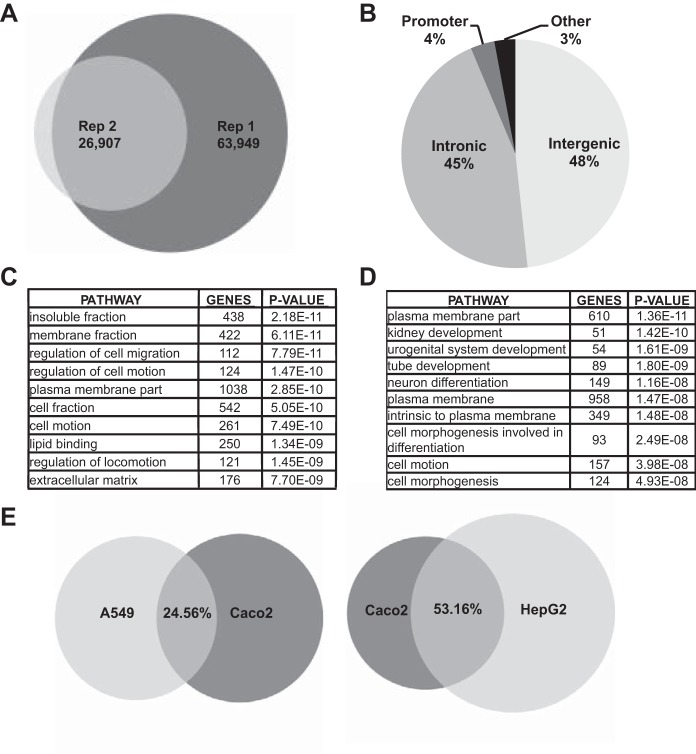
Forkhead box A (FOXA)2 chromatin immunoprecipitation followed by deep sequencing (ChIP-seq) in Caco2 intestinal epithelial cells. A: Venn diagram showing the overlap of the FOXA2 binding sites in 2 biological replicates of the ChIP-seq experiment. B: distribution of the combined FOXA2 peaks by genomic location. C: gene ontology (GO) pathways enriched in the combined FOXA2 binding sites dataset. D: GO terms enriched in FOXA2 dataset unique to Caco2 cells after removing peaks shared with HepG2 and A549. E: Venn diagrams showing the FOXA2 binding sites shared between A549 and Caco2 (left) and HepG2 and Caco2 (right).

