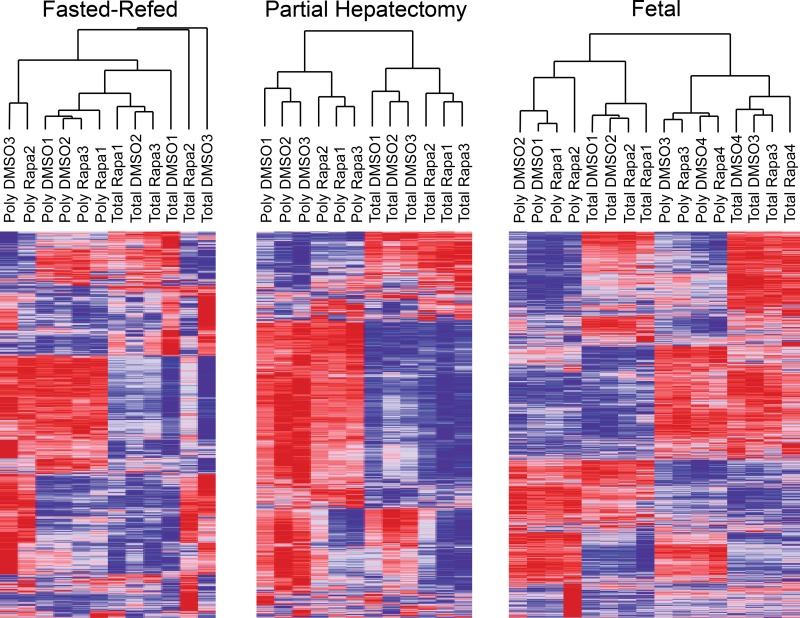
Fig. 3.
Heat maps and hierarchical clustering of all microarray results. The coefficient of variance was calculated for each gene within each experimental group. After we stratified the genes based on this metric, the 10% of genes with the greatest variance within each group were selected for inclusion in this analysis.

