Fig. 7.
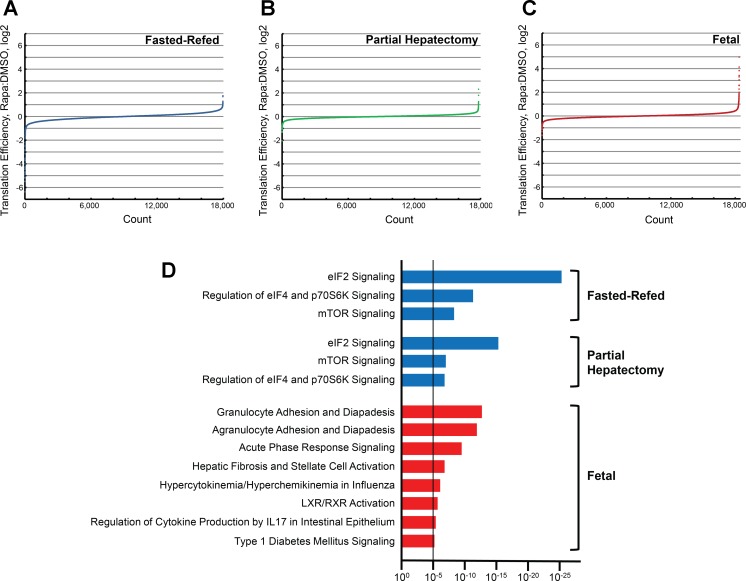
Ingenuity Pathway Analysis (IPA) of translation efficiency. The input data for IPA was generated by selecting genes whose translation efficiency was most affected by rapamycin. Translation efficiency data from all 3 experiments were stratified for rapamycin effect (ratio of rapamycin:DMSO for the mean translation efficiency for each gene) and graphed from lowest to highest. Results are shown separately for the 3 experiments: fasted-refeeding (A), partial hepatectomy (B), and fetal (C). IPA was performed based on this stratification of rapamycin effect (D). Genes beyond 2 SDs from the mean for which rapamycin reduced translation efficiency (blue bars) or increased translation efficiency (red bars) were selected for analysis, as were 5 randomly selected control groups (rapamycin effect <1 SD from the mean). Results are shown for all canonical pathway categories that were significant based on a P value that was smaller than the lowest P value obtained for the control data sets (dashed line). mTOR, mechanistic target of rapamycin; LXR, liver X receptor; retinoid X receptor.

