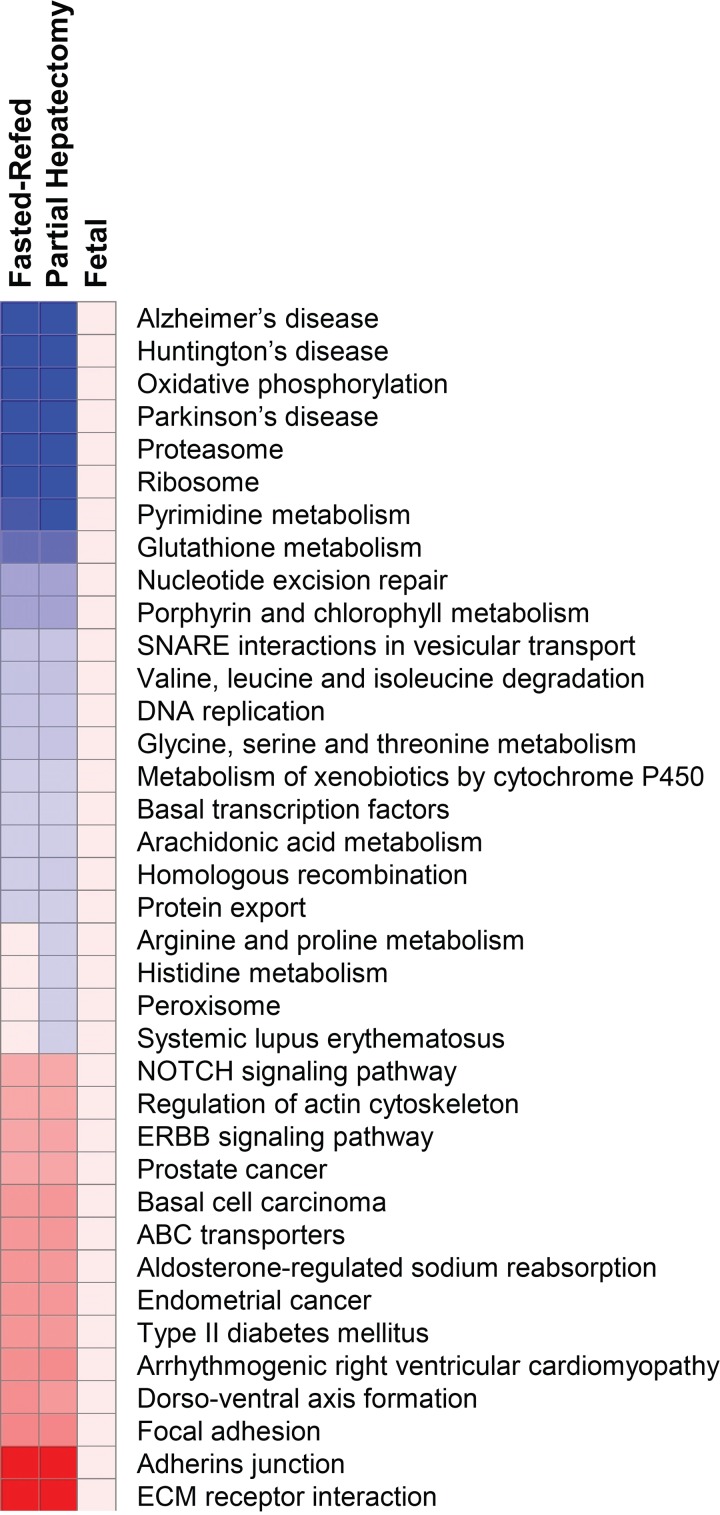
Fig. 8.
GSEA of translation efficiency. Translation efficiency data for all 3 experiments was analyzed by GSEA (C2 KEGG) and depicted as a heat map. All gene sets that were significant for any experiment are shown. The heat map depicts the response to rapamycin. Gene sets that were enriched for upregulated genes are shown in red, and those that were enriched for downregulated genes are in blue. The intensity of the color is proportional to the degree of significance based on FDR Q value.

