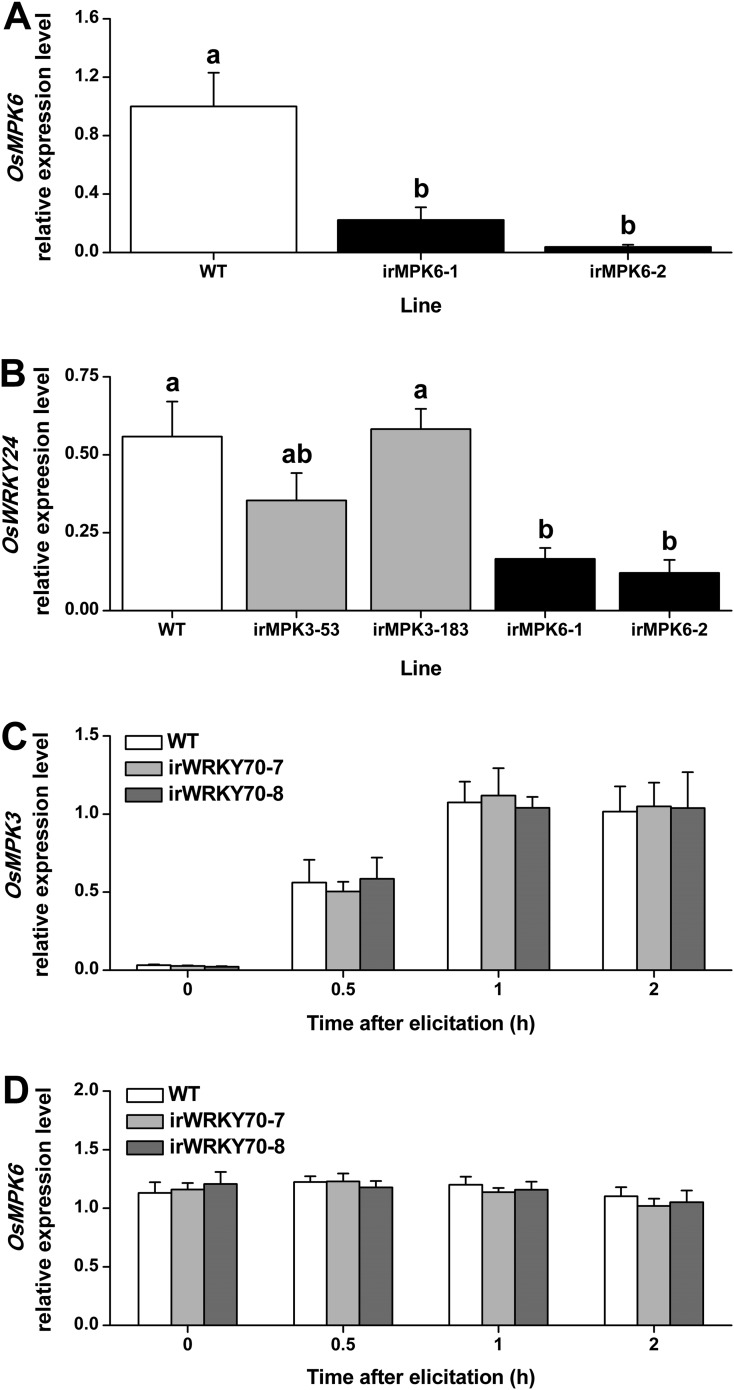
Figure 3. Transcript levels of OsMPK6, OsWRKY24, OsMPK3, and OsMPK6 in different transgenic lines.
(A) Mean expression levels (+SE, n = 6) of OsMPK6 in OsMPK6 silenced lines (irMPK6-1 and irMPK6-2). Samples used for QRT-PCR were from plant stems that were infested by SSB for 1 hr. (B) Mean transcript levels (+SE, n = 5) of OsWRKY24 in irMPK3 (irMPK3-53, irMPK3-183) and irMPK6 lines after infestation by SSB for 1 hr. (C, D) Mean transcript levels (+SE, n = 5) of OsMPK3 (C) and OsMPK6 (D) in irWRKY70 lines after infestation by SSB for 1 hr. Letters indicate significant differences among different lines (p < 0.05, Duncan's multiple range test).

