. 2015 Jun 17;4:e06914. doi: 10.7554/eLife.06914

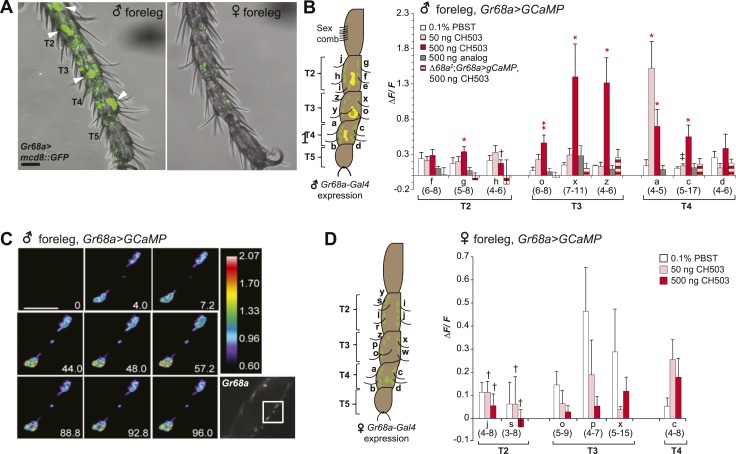
Figure 3. Gr68a is essential for CH503-evoked neuronal responses in the male foreleg.

(A) Visualization of GFP-labeled Gr68a-expressing neurons reveals neuronal and non-neuronal cells (arrowheads) in tarsal segments T2-5 from the male foreleg. Scale bar: 35 μm. (B) Gr68a-expressing neurons in the male foreleg show changes in Ca2+ activity in response to two doses of CH503 (pink, red). The behaviorally inert analog (R)-3-Acetoxy-11, 19-octacosadiyn-1-ol fails to elicit a significant response (gray). No increase in ΔF/F is observed from the forelegs of ΔGr68a-mutant flies (red stripes). Cells are designated according to the schematic (left) showing sensory neurons (green) and non-neural cells (yellow). For each cell type, the averaged response ± SEM and sample size is shown; Student's t-test with unequal variance, *p < 0.05, **p < 0.01. Unless otherwise indicated, statistical power is at least 0.8 for a significance level of 0.05 for the 50 and 500 ng CH503 doses. ‡N = 47 required for power of 0.8; †N = 201 required for 0.8 power. (C) A color-coded time course from 0–96 s showing the response in T2 Gr68a neurons evoked by 500 ng of CH503. The positions of the neurons on the foreleg are shown in the raw fluorescent image (bottom right corner, square). See also Figure 3—figure supplement 1 and Video 1. Scale bar: 10 μm. (D) Gr68a-expressing neurons on the female foreleg do not show a statistically significant response to (R, Z, Z)-CH503. Student's t-test with unequal variance, p > 0.05 for all cells tested. Error bars indicate SEM; sample sizes are shown below each cell type. Unless otherwise indicated, statistical power is at least 0.8 for a significance level of 0.05 for the 50 and 500 ng CH503 doses. †N ∼ 100 needed to achieve 0.8 power.

DOI: http://dx.doi.org/10.7554/eLife.06914.008

Figure 3.

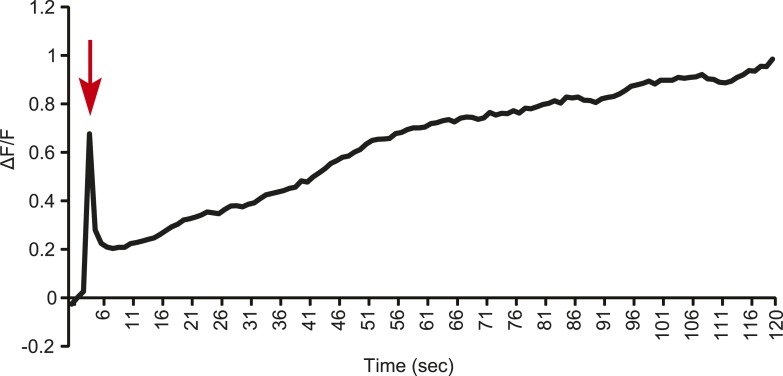
Figure 3—figure supplement 1. Line graph representation showing the tonic response of a T2 Gr68a neuron upon stimulation with 500 ng of CH503.

Figure 3—figure supplement 1.

Red arrow indicates the time at which the stimulus was added.
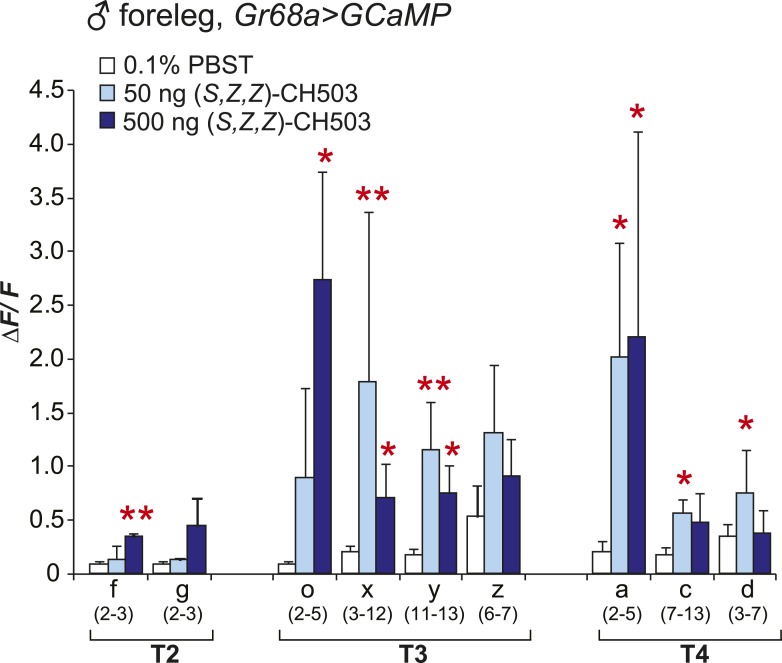
Figure 3—figure supplement 2. Physiological responses of male Gr68a neurons to (S, Z, Z)-CH503.

Figure 3—figure supplement 2.

An increase in intracellular Ca2+ levels was observed in Gr68a-expressing neurons upon application of (S, Z, Z)-CH503. Two cells (o, x) showed a higher ΔF/F increase in response to 500 ng of (S, Z, Z)-CH503 (dark blue) compared with the natural pheromone applied at the same dose (Figure 3B, red). Maximum ΔF/F values plateau at 50 ng of (S, Z, Z)-CH503 in 5 cells (x, y, a, c, d). The averaged response for each cell type ± SEM and sample size is shown; Student's t-test with unequal variance, *p < 0.05, **p < 0.01.
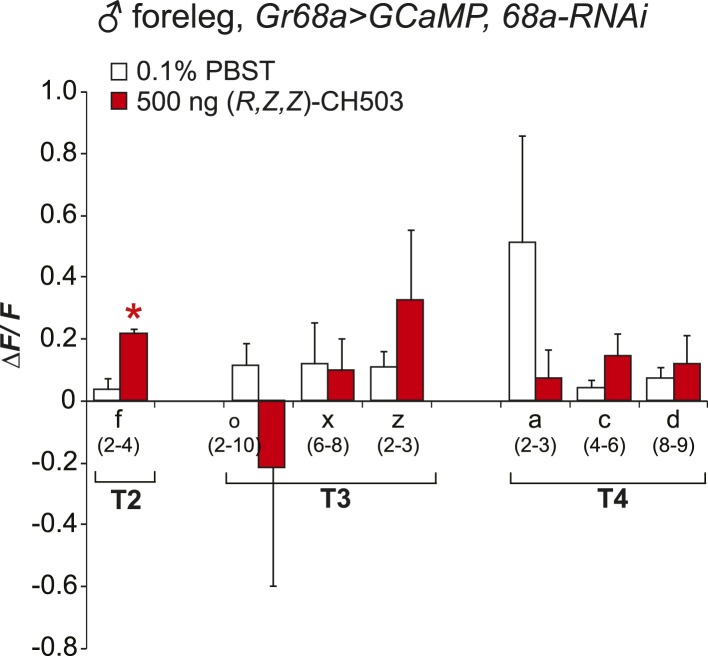
Figure 3—figure supplement 3. Physiological responses of Gr68a neurons upon RNAi-mediated silencing of Gr68a expression.

Figure 3—figure supplement 3.

RNAi-mediated suppression of Gr68a severely reduces neural responses induced by (R, Z, Z)-CH503 (red). In most cells, the response to the pheromone was not distinguishable from the response to buffer (white), with the exception of cell f. The averaged response for each cell type ± SEM and sample size is shown; Student's t-test with unequal variance, *p = 0.016.
Figure 3—figure supplement 4. Physiological responses of ppk23 proboscis neurons to (R, Z, Z)-CH503.

Figure 3—figure supplement 4.

(A) Application of 500 ng of CH503 elicited a significant ΔF/F increase in ppk23-expressing neurons on the male proboscis (red). In contrast, ppk23-expressing neurons from the female proboscis did not show a significant change in ΔF/F. The averaged response for each cell type ±SEM and sample size is shown; Student's t-test, *p = 0.012. (B) A color-coded time course from 0 to 96 s showing the response of ppk23 neurons on the proboscis to 500 ng of CH503. Heterogeneity in response times is apparent amongst the different cell types with some cells responding intensely at 6.4 s and others only ∼88 s after CH503 application. See also Video 2. The positions of the neurons on the proboscis are shown in the raw fluorescent image (bottom right corner). Scale bar: 10 μm.
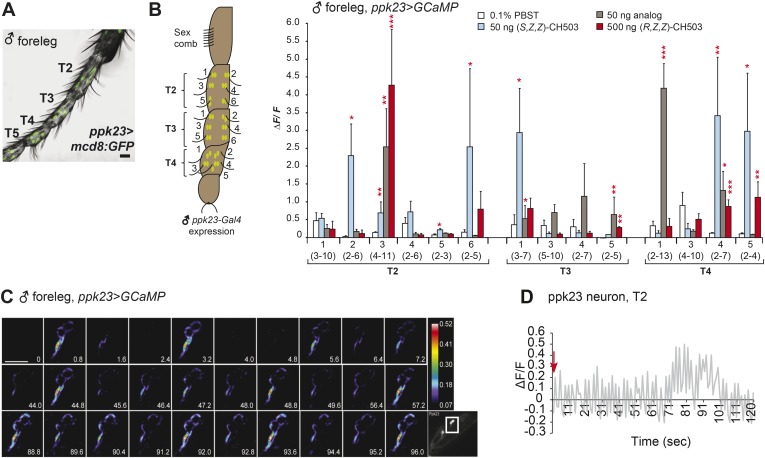
Figure 3—figure supplement 5. Physiological responses of ppk23 leg neurons to (R, Z, Z)-CH503.

Figure 3—figure supplement 5.

(A) Visualization of GFP-labeled ppk23-expressing neurons in the male foreleg in tarsal segments T2-5. Scale bar: 35 μm. (B) Ppk23-expressing neurons on tarsal segments T2-5 were stimulated with 50 ng of (S, Z, Z)-CH503, an equivalent dose of the behaviorally inactive analog (S)-3-acetoxy-11-octacosen-1-ol or 500 ng of (R, Z, Z)-CH503. A robust increase in ΔF/F specific to (S, Z, Z)-CH503 was elicited from 2 cells on T2 and 1 cell on T3. Several cells in each segment displayed a robust response to the analog. The averaged response for each cell type ± SEM and sample size is shown, Student's t-test, *p < 0.05, **p < 0.01, ***p < 0.001. (C) A color-coded time course from 0 to 96 s showing the response in ppk23-expressing neurons on the male foreleg to 500 ng of CH503. The cells exhibit a bursting response consisting of fluorescence intensity increasing at periodic intervals for the duration of the recording. See also Video 3. The positions of the neurons on the foreleg are shown in the raw fluorescent image (bottom right corner). Scale bar: 10 μm. (D) Line graph representation showing the oscillatory response of a T2 ppk23 neuron upon stimulation with 500 ng of CH503. Red arrow indicates the time point at which the stimulus was added.
Figure 3—figure supplement 6. Gr68a-Gal4 and fruitless (fru)-expression in the foreleg do not co-localize.

Figure 3—figure supplement 6.

Pearson's coefficients: 0.06 (left) and 0.02 (right); scale bar: 50 μm.