. 2015 Jun 17;4:e06914. doi: 10.7554/eLife.06914

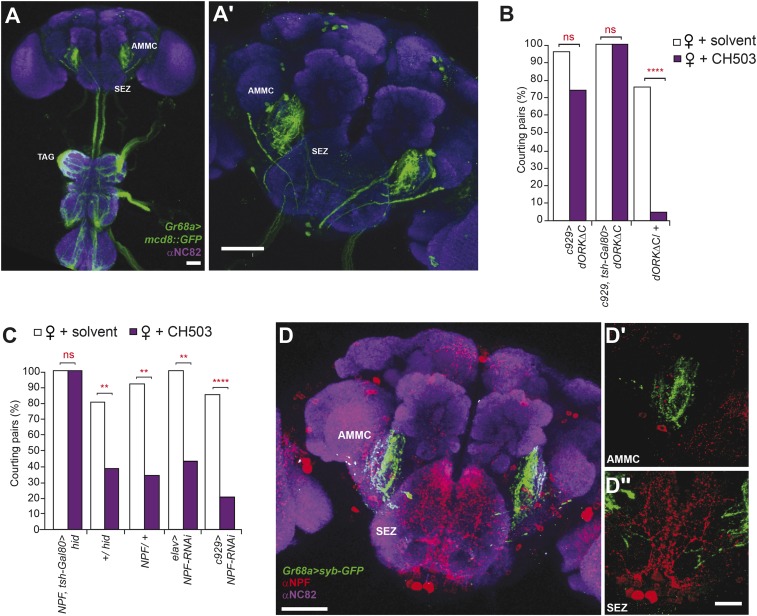
Figure 4. Higher order neural circuits essential for processing CH503.

(A) Gr68a-Gal4-labeled afferent projections extend to the thoracico-abdominal ganglia (TAG), subesophageal zone (SEZ), and antennal mechanosensory and motor center (AMMC). Image represents a maximum intensity Z-series projection. Scale bar A: 25 μm; A′: 50 μm. (B) Inhibition of electrical activity in c929-Gal4-labeled neurons with UAS-dORKΔC, an inwardly rectifying K+ channel, resulted in high courtship levels in the presence of CH503. Suppressing Gal4 expression in the ventral cord with a tsh-Gal80 transgene (hence, limiting dORKΔC expression primarily to the central brain) failed to restore sensitivity to CH503. No change in CH503 response was observed in the absence of the c929-Gal4 driver. N = 23–25, Fisher's exact probability test, ns: not significant, ****p < 0.0001. (C) Ablation of central brain neural circuits associated with NPF abolished the courtship suppression response to CH503. The courtship behavior of genetic controls was unaffected. Silencing NPF expression in all neural cells (using elav-Gal4) or in peptidergic neurons (using c929-Gal4) did not alter flies' sensitivity to CH503. N = 14–33, Fisher's exact probability test, ns: not significant, **p < 0.01, ****p < 0.0001. (D) NPF-expressing processes are closely apposed to Gr68a-Gal4 synaptic terminals labeled with synaptobrevin-GFP (syb-GFP) in the AMMC (D′) and SEZ (D′′). No co-localization is observed (Pearson's coefficient: 0.01). Image represents a maximum intensity Z-series projection. Scale bar D: 50 μm; D′, D′′: 20 μm.

DOI: http://dx.doi.org/10.7554/eLife.06914.019

Figure 4.

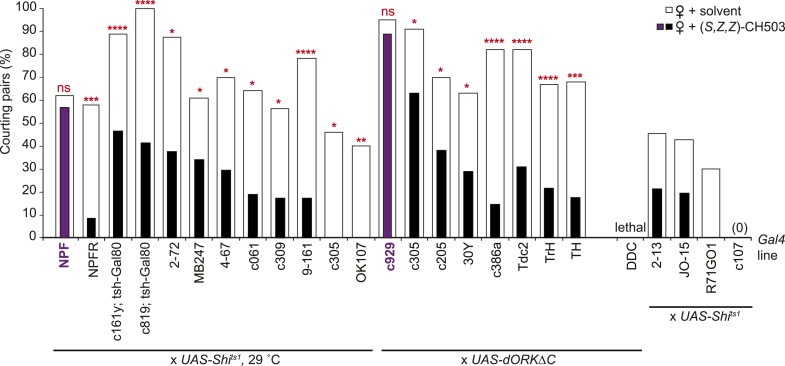
Figure 4—figure supplement 1. Central brain screen to identify CH503-processing circuits.

Figure 4—figure supplement 1.

Inactivation of neural activity by expression of the temperature-sensitive Shibire transgene (UAS-Shits1) or UAS-dORKΔC within NPF- and c929-Gal4 circuits resulted in a loss of sensitivity to CH503 (purple vs white). It was not possible to assess some Gal4 lines (far right) due to low activity or lethality upon suppression of neural activity. N = 8–24 for each line, Fisher's exact probability test, ns: not significant; *p < 0.05; **p < 0.01; ***p < 0.001; ****p < 0.0001.
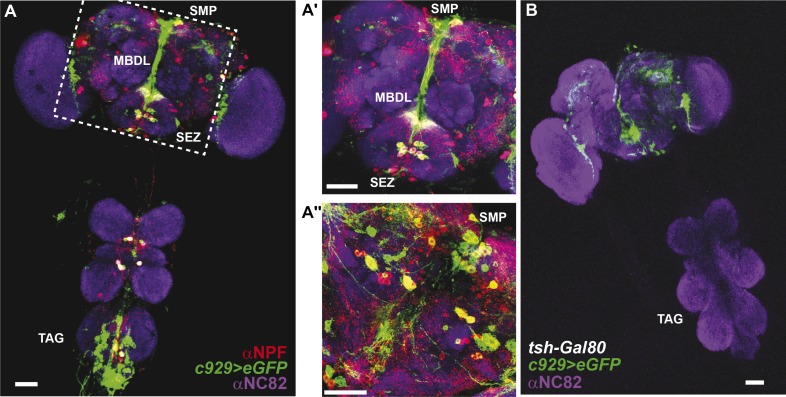
Figure 4—figure supplement 2. Co-expression of anti-NPF immunostaining with c929-Gal4-directed GFP expression.

Figure 4—figure supplement 2.

(A) Co-expression is observed in cell bodies housed in the thoracico-abdominal ganglia (TAG), subesophageal zone (SEZ), superior medial protocerebrum (SMP), and processes along the median bundle (MBDL). (A′) Magnification of square in A. (A′′) Z-section from another depth. Images represent maximum intensity Z-series projections. Scale bar A: 25 μm; A′ and A′′: 50 μm. (B) The tsh-Gal80 transgene restricts c929-Gal4 expression to the brain Scale bar: 25 μm.
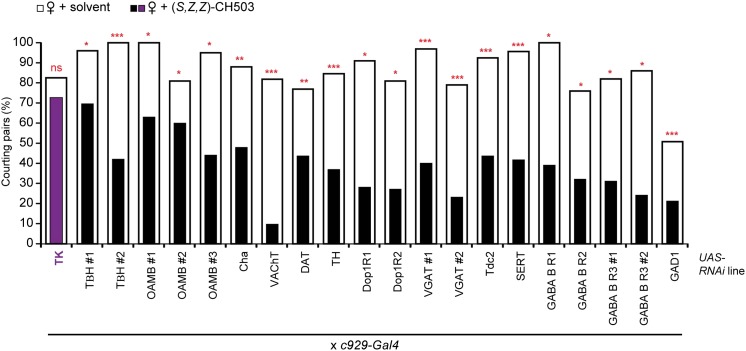
Figure 4—figure supplement 3. Screen of tachykinin and small transmitter systems within the c929-Gal4 circuit.

Figure 4—figure supplement 3.

RNAi-mediated silencing of tachykinin (TK) expression within the c929-Gal4 circuit inhibits sensitivity to (S, Z, Z)-CH503 (purple vs white). RNAi manipulation of other neurotransmitter systems did not have a significant effect on CH503-detection (black vs white). N = 21–35, Fisher's exact probability test, ns: not significant; **p < 0.01; ***p < 0.001.
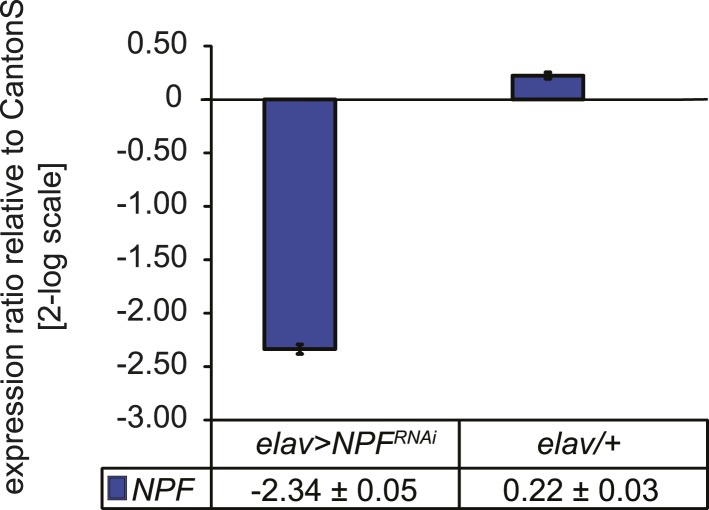
Figure 4—figure supplement 4. Characterization of NPF transcript levels.

Figure 4—figure supplement 4.

Quantitative PCR analysis of NPF transcript levels from heads of elav>NPF-RNAi and elav/+ control flies. RNAi induces a 5.3-fold reduction of NPF transcript levels. Gene expression levels are shown normalized to wildtype CantonS levels. Data show normalized average ± standard deviation (SD), N = 3.