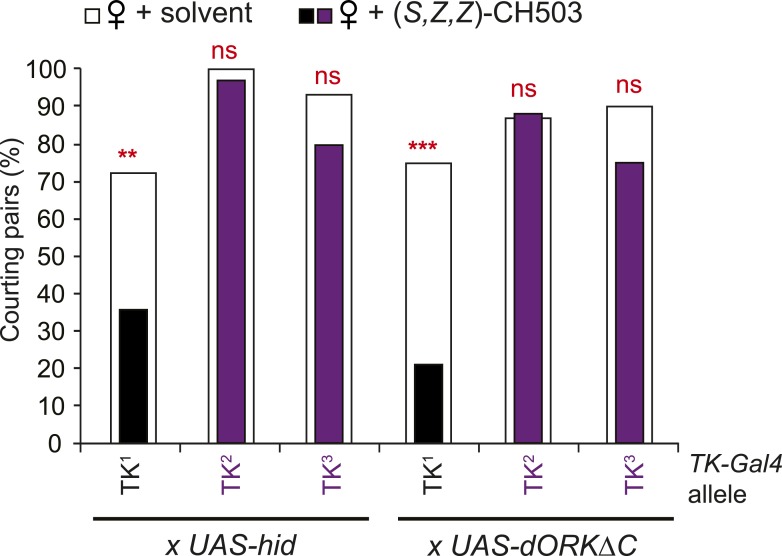
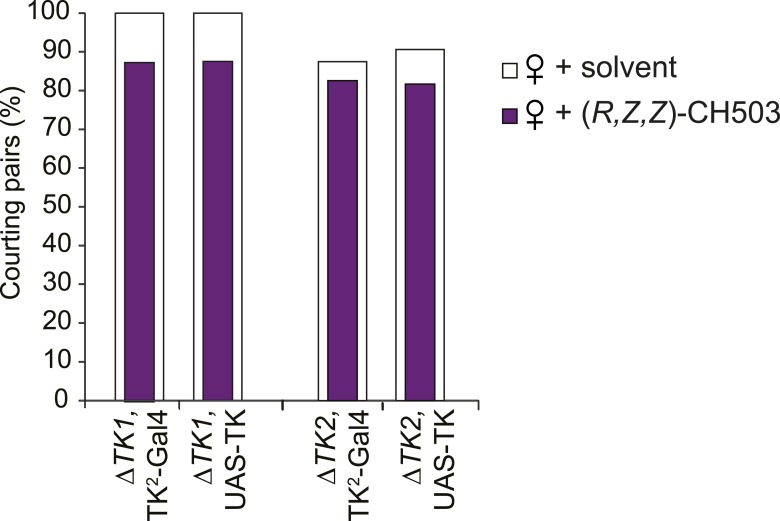
Figure 5. Tachykinin-expressing cells in the SEZ are a second order circuit for Gr68a neurons.
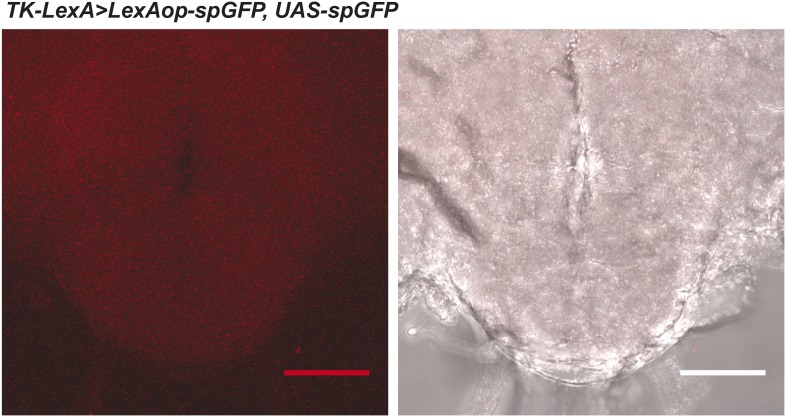
(A) Ablation of TK-expressing circuits using two independent Gal4 drivers (TK2 and TK3) removed sensitivity to CH503. Homozygous or trans-heterozygous ΔTK deletion mutants also exhibit a loss of sensitivity to CH503. Rescuing TK expression in two different mutant backgrounds restored the behavioral response to CH503. See Figure 5—figure supplement 2 for parental controls. N = 15–31, Fisher's exact probability test, ns: not significant, ****p < 0.0001. (B, C, E) TK-expressing cells are closely apposed to Gr68a-Gal4 synaptic terminals labeled with synaptobrevin-GFP (syb-GFP) in the SEZ (C) and AMMC (E). No co-localization is observed (Pearson's coefficient: 0). Image represents a maximum intensity Z-series projection. (D, D′) Positive GRASP-GFP signal in the SEZ indicates synaptic connectivity between Gr68a neurons and TK processes. The GFP signal is overlaid on a phase-contrast image of the tissue (arrows). (F, F′) Positive GRASP-GFP signal in the AMMC indicates synaptic connectivity between Gr68a neurons and TK processes. The GFP signal is overlaid on a phase-contrast image of the tissue (rectangle). Scale bar B: 50 μm; all other scale bars: 20 μm.


