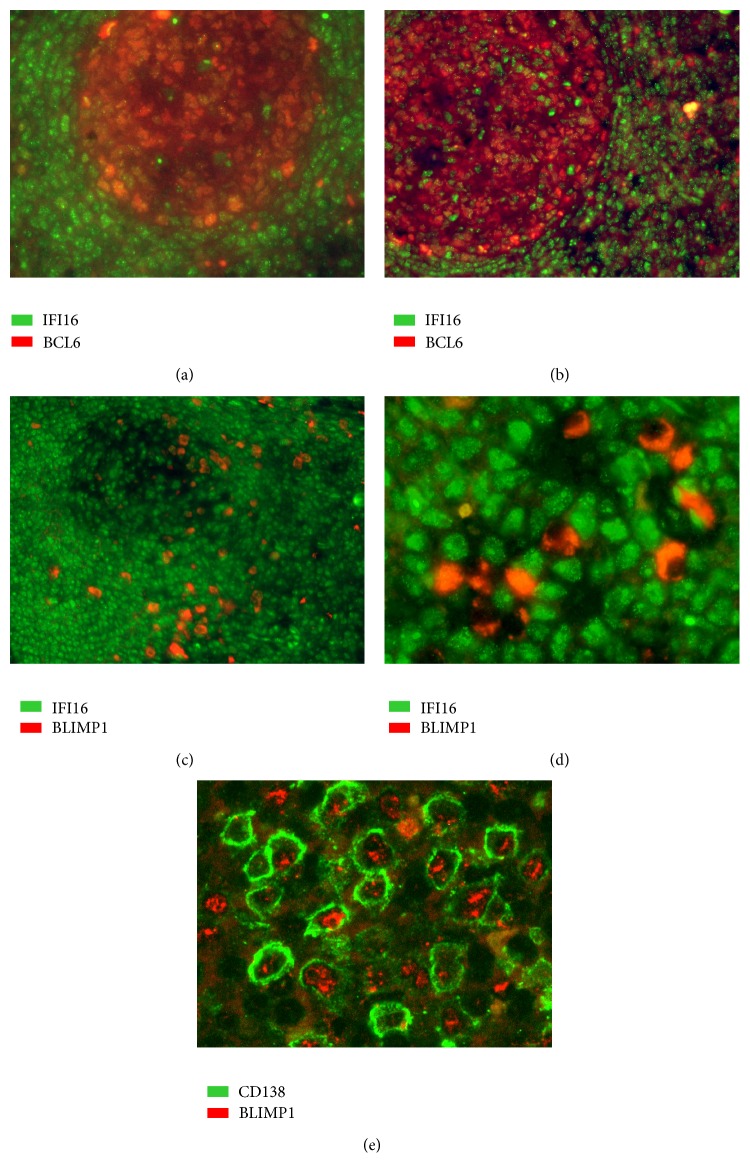
Figure 6.
Double-staining immunofluorescence analysis of IFI16/BCL-6 and IFI16/BLIMP1 protein expression levels. Double-staining immunofluorescence analysis demonstrated the inverse relationship between IFI16 (green) and either BCL6 (red; (a-b) magnification 200x and 100x, resp.), or BLIMP1 (red; (c-d), magnification 100x and 400x, resp.). The latter, in particular, showed a mutually exclusive expression patterns with IFI16. Specifically, plasma cells in panel (d) were BLIMP1+/IFI16−, while the surrounding lymphocytes were BLIMP1−/IFI16+. In (e) (magnification 400x) double-staining immunofluorescence analysis showed the coexpression of BLIMP1 (red) and plasma cell marker CD138 (green). These micrographs were obtained using an Olympus BX61 microscope equipped with an Olympus DP-70 digital camera; image acquisition, evaluation, and color balance were performed using Cell∧F software.

