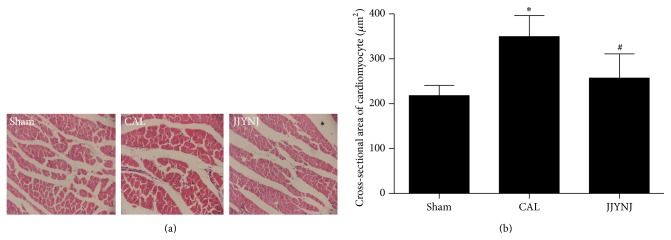
Figure 2.

Hematoxylin and eosin staining demonstrating cross-sectional area of cardiomyocyte of left ventricular tissue section from sham, CAL, and JJYNJ treated rats 4 weeks after coronary artery ligation. Each bar is expressed as means ± standard deviation; ∗ p < 0.05 when compared to the sham; # p < 0.05 when compared to the CAL (magnification: ×400).
