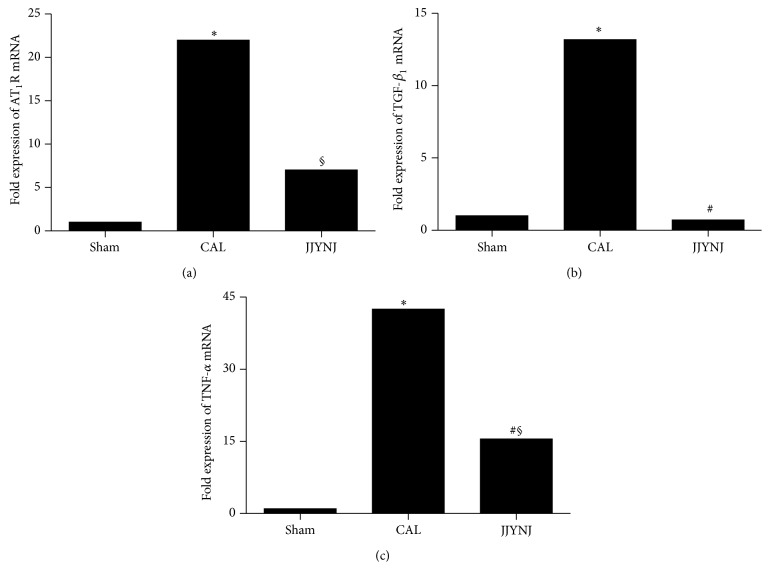
Figure 4.
Real time RT-PCR was performed for analyzing AT1R mRNA (a), TGFβ 1 mRNA (b), and TNF-α mRNA (c) expression using left ventricular tissue obtained from sham, CAL, and JJYNJ treated rats 4 weeks after coronary artery ligation. GAPDH was used as a quantitative control. Each bar is expressed as means; ∗ p < 0.05 when compared to the sham; # p < 0.05 when compared to the CAL; § p < 0.05 when compared to the sham.

