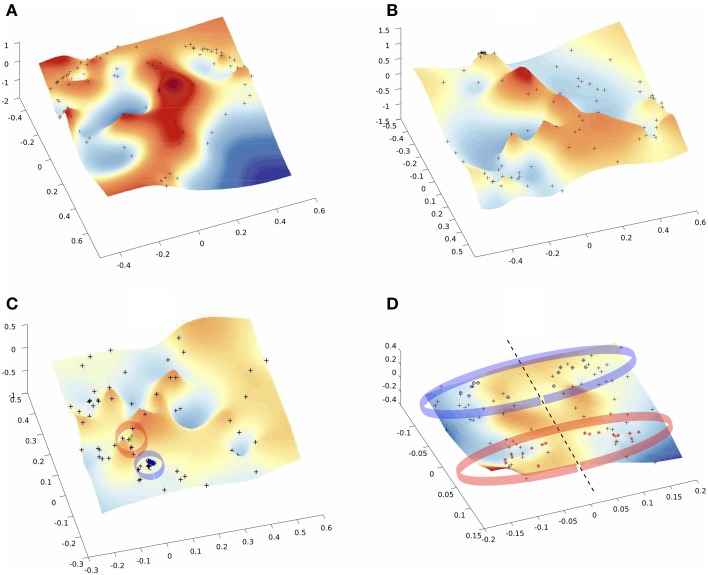
Figure 4.
Multi-Dimentional Scaling (MDS) of the embedded networks (A) fMRI single subject (B) fMRI average embedded network (C) fMRI Algebraic Topological aggregation (multiplex) embedded network (D) DTI embedded network. Black dots indicate the embedded nodes. In plots (C,D), blue and red points indicate the groups of brain areas discussed in the text.

