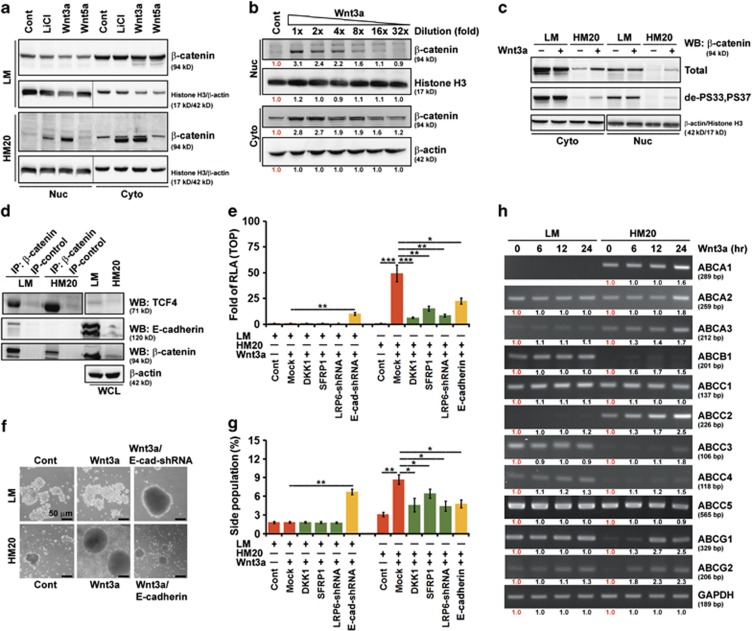
Figure 5.
Wnt signaling can be reactivated and promote the CSC phenotype only in E-cadherin-deficient cells. A549 cells were cultivated in suspension for 24 days and then migrated back onto the plate to reform a monolayer (LM cells). LM cells were functionally fractionated by invasive assays, 5 times (HM5 cells), 10 times (HM10 cells) and 20 times (HM20 cells). (a) Western blotting (WB) analysis of nuclear (Nuc) and cytosolic (Cyto) fractions of LM and HM20 cells after treatment with control, LiCl, Wnt5a or Wnt3a-containing medium. (b) WB analysis of Nuc and Cyto fractions of HM20 cells after treatment with decreasing concentrations of Wnt3a. The relative intensities of the bands are shown. (c) WB analysis of Nuc and Cyto fractions of LM and HM20 cells after treatment with control or Wnt3a-containing medium. de-PS33,PS37: dephosphorylated-S33,S37 β-catenin; PS33,PS37,PT41: phosphorylated-S33,S37,T41 β-catenin. (d) Whole-cell lysates (WCLs) were prepared from LM and HM20 cells and then IP using anti-β-catenin was carried out followed by WB analysis. (e) WCLs were prepared from LM or HM20 cells infected with a lentivirus encoding an shRNA targeting LRP6 and CDH1, or transfected with plasmids encoding DKK1, SFRP1 and E-cadherin, before Wnt3a treatment. A TOPflash luciferase reporter assay was performed. RLA, relative luciferase activity. (f) Microscopic analysis of spheres cultivated in suspension for 12 days; spheres were derived from LM and HM20 cells after treatment with control or Wnt3a-containing medium. LM or HM20 cells infected with a lentivirus encoding an shRNA targeting CDH1, or transfected with plasmids encoding E-cadherin, before Wnt3a treatment. (g) Cells described in e were stained with Hoechst 33342. SP cells were counted. (h) mRNA was prepared from LM and HM20 cells in the presence of Wnt3a for the indicated times. Expression of the ATP-binding cassette (ABC) transporter family genes was evaluated by reverse transcriptase–PCR. The relative intensities of the bands are shown. Data in e and g were derived from three independent experiments and are presented as the mean±s.d. *P<0.05; **P<0.01; ***P<0.005 (t-test).

