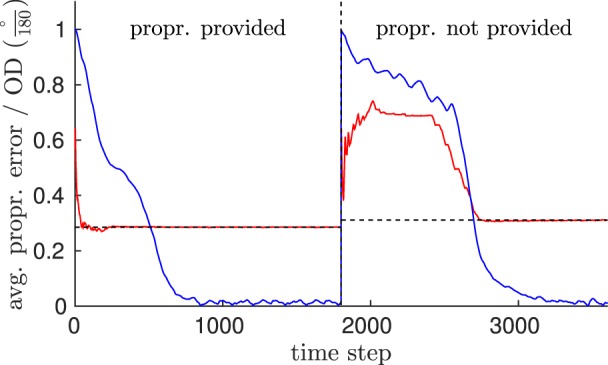
Figure 11.

Evaluation of the model's feature inference capability. This shows a comparison of the prediction error in the proprioceptive pathway (RMS) while pattern neurons were driven by both visual and proprioceptive information (left side of the dashed vertical line), in contrast to the error observed while pattern neurons were driven by vision only (right side of the vertical line). Information was given by the observation of a walking trial, perceived from an unknown view. Blue indicates the orientation difference of the derived orientation to the egocentric orientation, while red indicates the moving average of the error in inferring proprioception (dashed horizontal lines indicate the level of convergence).
