Figure 2.
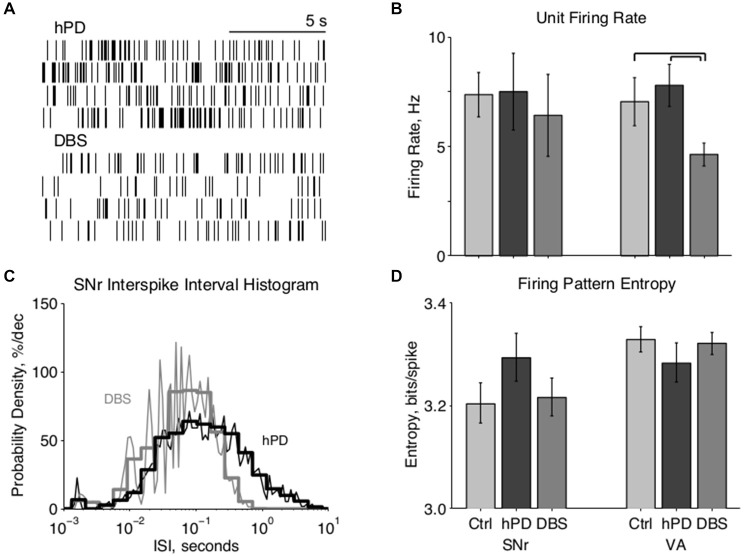
Single unit firing pattern activity. (A) Representative rastergrams of four consecutive 15 s intervals recorded from the same VA neuron in hPD and STN-DBS conditions, firing at ~8 Hz and ~3 Hz, respectively. (B) Population firing rates of single units in SNr and VA in all conditions, mean ± 50% c.i. Unit rates ranged from ~1 Hz to over 50 Hz, and this extreme variability nullified statistical differences between most conditions. In VA, however, STN-DBS did reduce firing rates significantly from healthy and hPD levels (pbca < 0.001). (C) Representative fine (thin lines, 25 bins/decade) and coarse (thick lines, five bins/decade) ISI histograms of an SNr neuron in the hPD and STN-DBS conditions. The wide distribution in the hPD case is regularized via entrainment to 100 Hz DBS, as shown by ISI peaks at 10 ms and subharmonics thereof, and a narrowing of the full distribution. (D) Population firing pattern entropy estimated from coarse (five bins/decade) ISI histograms, mean ± 50% c.i. A trend toward SNr entropy increase in the hPD condition did not reach significance with respect to either healthy (pbca = 0.06) or STN-DBS (pbca = 0.07) conditions.

