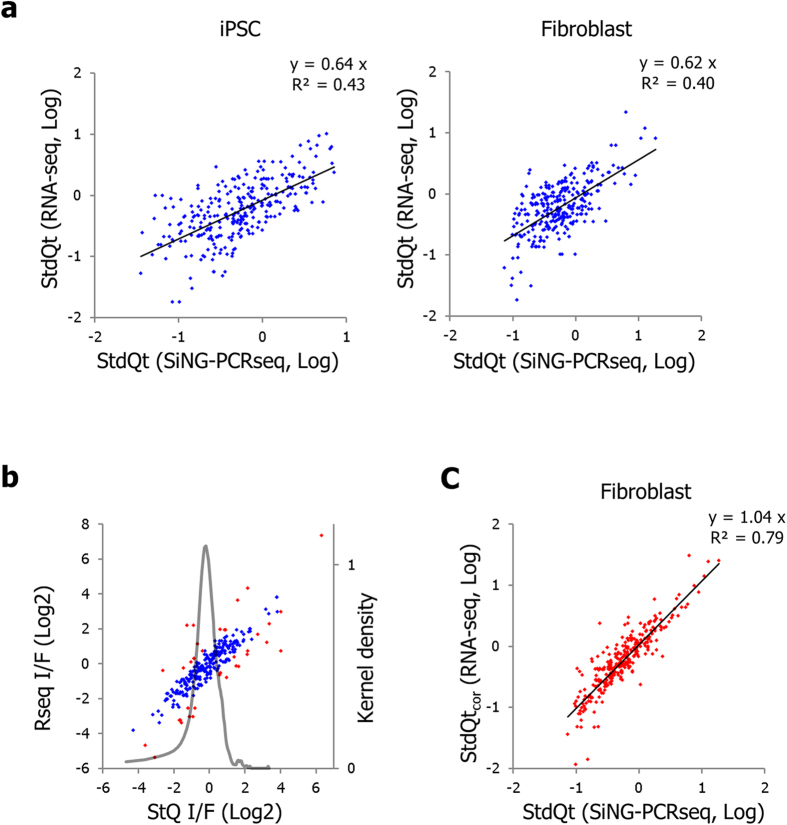
Figure 4. Comparison of SiNG-PCRseq with RNA-seq.
(a). The log-transformed standardized quantities obtained from two different quantitation approaches, SiNG-PCRseq and RNA-seq, plotted as scatter diagrams for two cell line samples. (b). The fold differences of cDNA quantities in two cell lines (I/F) determined for two different quantitation approaches and scatter plotted. Genes showing more than two fold differences in I/F are indicated as red. Kernel density (black solid line, right axis) plotted for fold differences in I/F between two measurement approaches. (c). Standard quantities derived from the RNA-seq method were corrected for systematic bias (StdQtcor) and are presented as a scatter plot against the standard quantities from SiNG-PCRseq.

