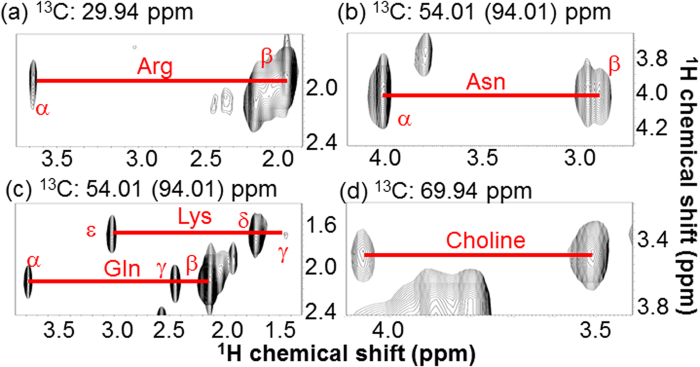
Figure 3. HR-MAS 3D HCCH-COSY spectrum of 13C-poplar, measured without sample extraction.
2D 1H-1H planes at (a) 29.94, (b) 54.01 (folded spectrum; 94.01), (c) 54.01 (94.01), and (d) 69.94 ppm of 13C axis of the 3D 1H-1H-13C spectrum are shown. Red lines connect the 1H-13C-13C-1H cross peaks of the assigned metabolites. Asn, Asparagine; Arg, Arginine; Lys, Lysine; Gln, Glutamine.

