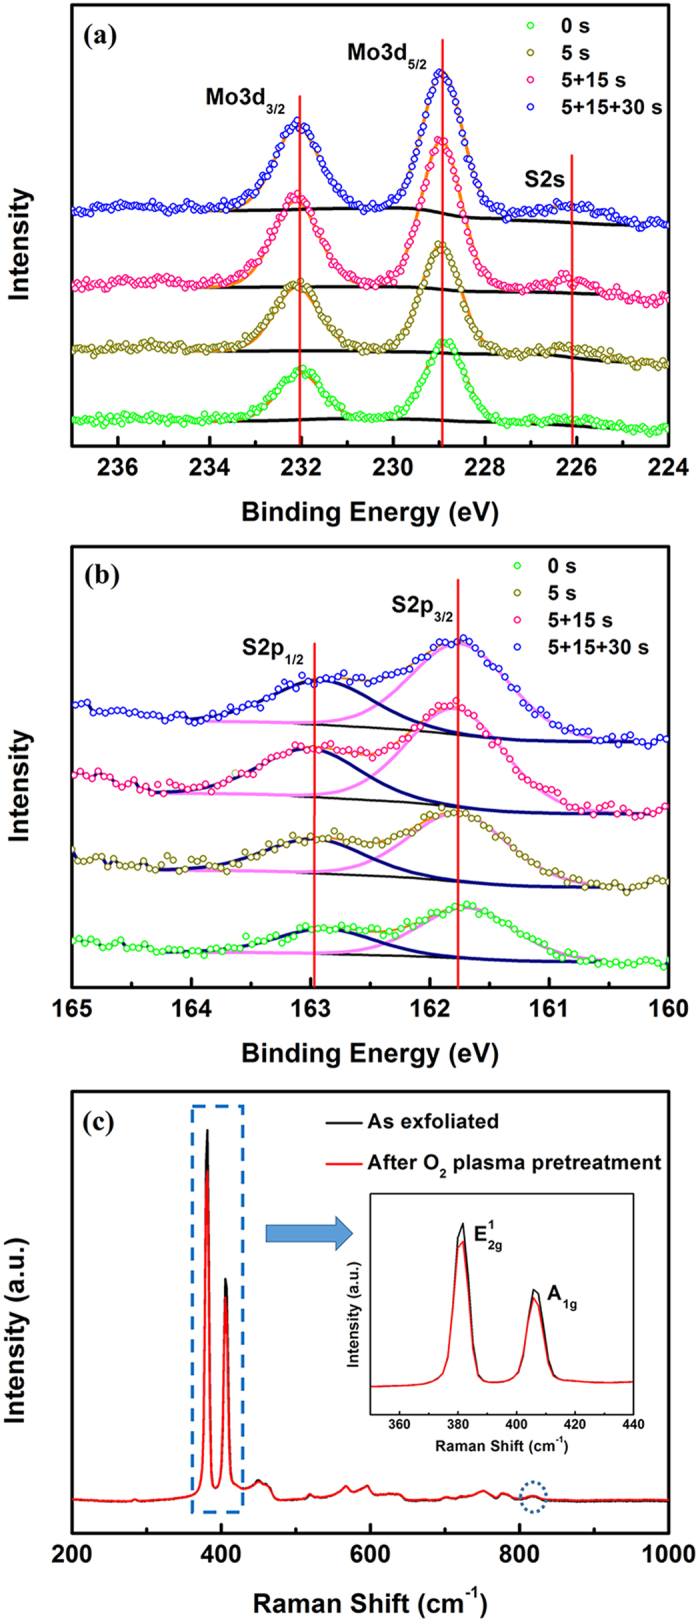
Figure 2.

(a) In-situ XPS spectra showing the Mo 3d and S 2s core level peak regions before and after remote O2 plasma treatments for various time. (b) In-situ XPS spectra showing the S 2p core level peak regions. (c) Raman spectra before and after the remote O2 plasma treatments. The inset is a zoom of the spectra showing the  and A1g peaks in MoS2. The blue dotted circle in (c) is used to highlight the peak near 820 cm−1 which is used to estimate the extent of MoS2 oxidation.
