
Figure 1. Putatively constitutive exon selection in GARNL1.
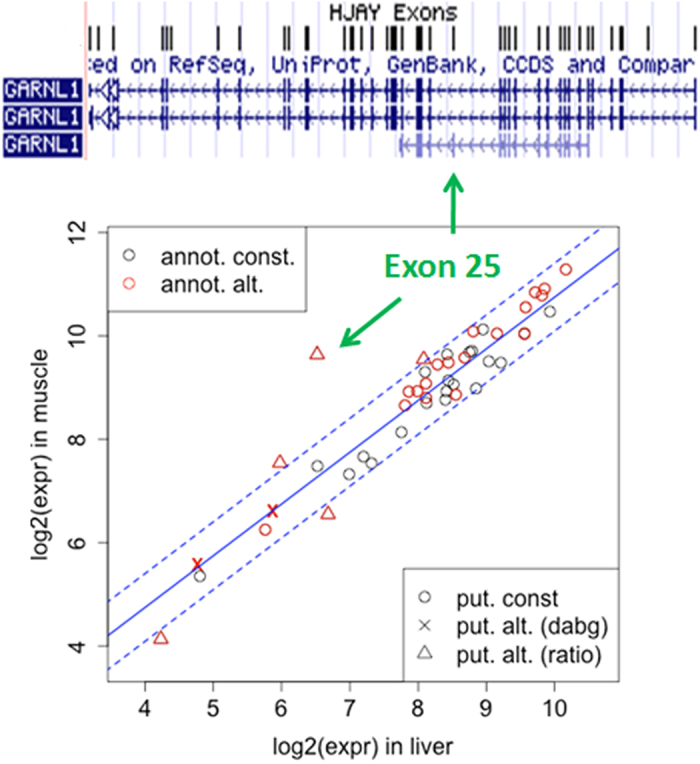
At the top, the gene structure of GARNL1 from UCSC Known Gene is shown with HTA exon probe sets. At the bottom, logged exon expression indices of liver and muscle are plotted. Black and red colors represent annotated constitutive and alternative respectively as in the design database of the HTA. The blue bold line represents an average expression ratio over all putative constitutive exons identified by RASA, and blue dashed lines show upper and lower boundaries set in the algorithm to call putative alternative exons. A putatively constitutive exon identified by RASA is marked with a circle. A putatively alternative exon identified by RASA is either categorized as absent in the sample (marked with a cross) or as significantly deviated from the average expression ratio of the putative constitutive exons (triangle). Exon 25 of the gene is later identified as an alternatively spliced exon between the tissues.