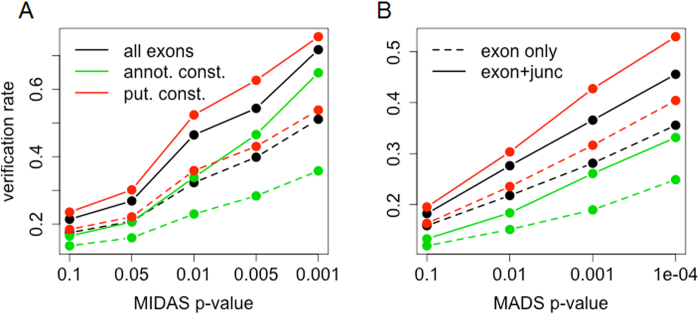
Figure 3. Performance comparison.
Comparisons of the performance of various methods to detect alternatively spliced exons. Verification rates are shown along with (A) MIDAS p-values and (B) MADS p-values. The methods calculating gene expression with all exons, annotated constitutive exons, and putatively constitutive exons are noted with black, green and red lines respectively. The detection results with and without junction supports are represented with bold and dashed lines respectively. The performance of RASA is plotted with red bold lines.

