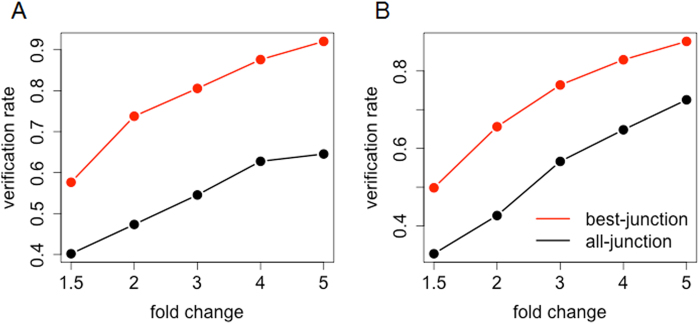
Figure 4. Performance comparison with all-junction approaches.
Performance comparison of (A) ASPIRE and (B) ASI with the proposed method. Red lines represent validation rates of the proposed method using a best-junction approach, and black lines represent the other two methods using an all-junction approach. RASA detected candidates first with a given fold change threshold (x-axis), the same number of top candidates by ASPIRE and ASI were compared, and the verification rates by mRNA-Seq data were presented (y-axis).

