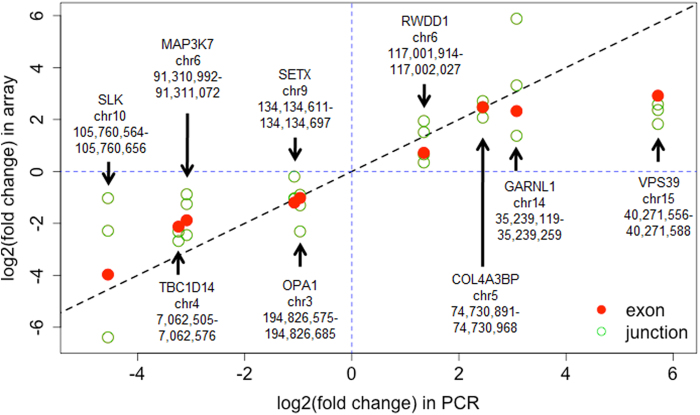
Figure 5. RT-PCR verification.
Comparison of HTA and RT-PCR results of nine selected alternative splicing candidates identified by RASA. Shown are fold changes of the expression levels of exon and junctions measured between liver and muscle. A positive logged fold change indicates over-expression in muscle over liver, and vice versa. Red and green circles represent exons and junctions respectively.

