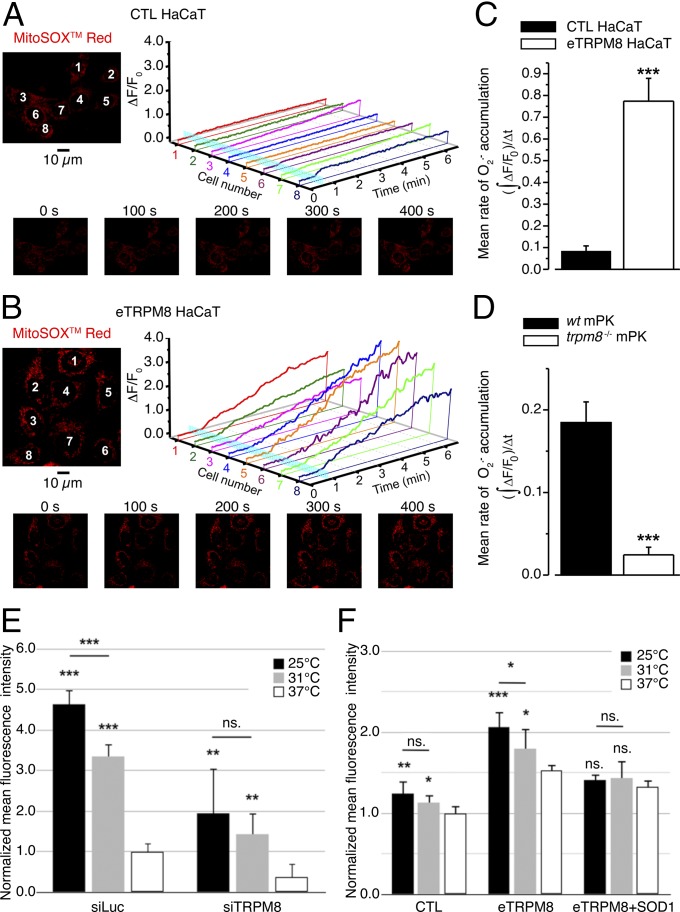
Fig. 5.
Icilin- and cold-induced O2•− accumulation depends on the level of eTRPM8 expression. (A and B) Confocal images of MitoSOX Red fluorescence revealed distinct mitochondrial staining in control HaCaT cells, CTL HaCaT (A), and HaCaT cells overexpressing epithelial TRPM8, eTRPM8 HaCaT (B). Changes in the MitoSOX fluorescence in response to stimulation with 10 μM icilin were monitored using the x-y time series imaging protocol. The MitoSOX fluorescence intensity (F) was normalized to the averaged fluorescence intensity before agonist application (F0). In A and B, relative changes in the fluorescence intensity (ΔF/F0), averaged within each of eight cells denoted by the numbers on the images (Upper Left), are plotted over time, respectively (Upper Right). Icilin application is depicted by a vertical cyan bar. The galleries (A and B, Lower) show the images of MitoSOX fluorescence captured at times indicated above the images. Mean rates of O2•− accumulation were estimated as masses of MitoSOX fluorescent signal per second following icilin application, , in CTL HaCaT (n = 28), in eTRPM8 HaCaT (n = 20), in primary cultures of either WT mouse keratinocytes (WT mPK) (n = 8) or trpm8 −/− mouse keratinocytes (trpm8 −/− mPK) (n = 10), and compared in C and D, respectively. (E) Steady-state superoxide concentration [O2•−] was assessed in living hNEKs after 72 h culturing at 37 °C, 31 °C, or 25 °C, using CellRox Deep Red Reagent. Cells were transfected either with control siRNA (siLuc) or with siRNA targeting the pore-encoding sequence of TRPM8 (siTRPM8). For each temperature and siRNA condition the measurements were performed in three Petri dishes, sequentially mounted on the microscope stage at the ambient temperature corresponding to the preincubation temperature. In each Petri dish confocal imaging of CellRox Deep Red fluorescence was performed from four fields of view, 230 × 230 µm (1,024 × 1,024 pixels) each. The O2•−- specific increases in the CellRox Deep Red signal mass (Materials and Methods) for each condition were averaged, normalized to the mean value detected at 37 °C in siLuc-transfected hNEKs, and compared. (F) The same as E, but for HaCaT cells transfected with empty vector (CTL), eTRPM8 plasmid, or eTRPM8 + SOD1 plasmids and cultured for 24 h at 37 °C, 31 °C, or 25 °C. The data were normalized to the mean value detected at 37 °C in HaCaT cells transfected with empty vector and compared. Note that the differences between corresponding values for different expression conditions (E and F) are statistically significant at all three temperatures tested with P < 0.05. Experiments in E and F were performed three times and include more than 200 cells per experiment.

