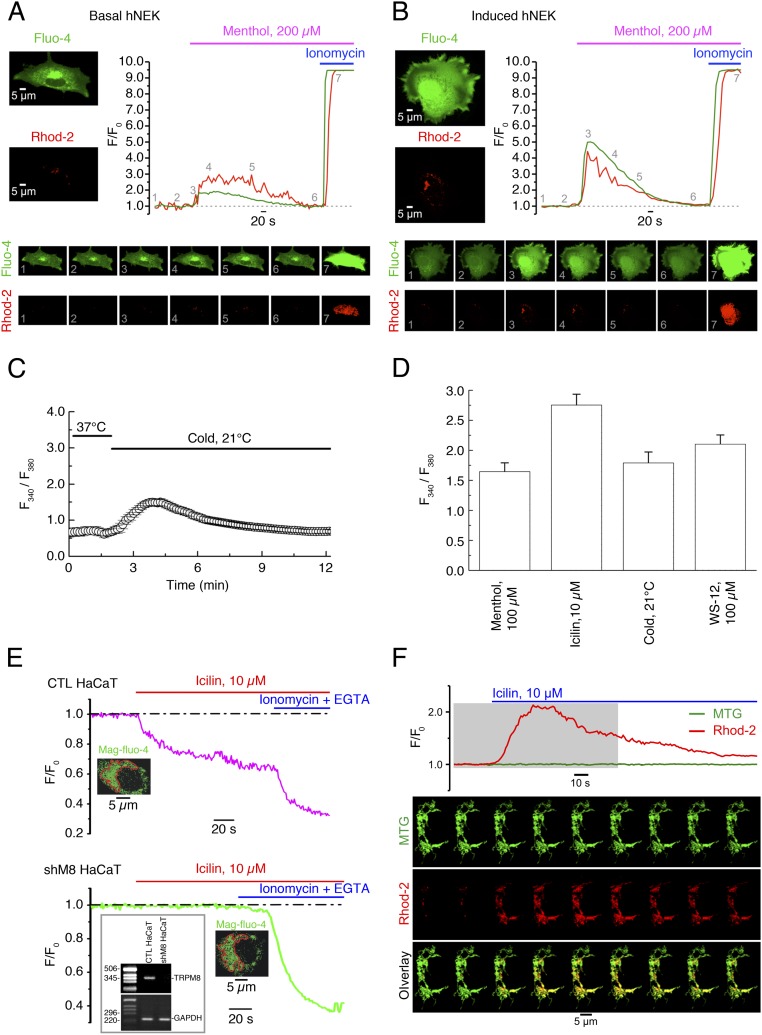
Fig. S3.
eTRPM8-mediated Ca2+ release results in mitochondrial Ca2+ uptake in human keratinocytes. (A and B) Changes of Ca2+ concentration in cytosol ([Ca2+]c) and mitochondria ([Ca2+]m) elicited by external application of 200 µM menthol were monitored using x-y time series imaging of fluo-4 and rhod-2 fluorescence, respectively, in (A) primary culture of basal and (B) induced (Materials and Methods) human primary culture keratinocytes (hPK). To eliminate capacitative Ca2+ entry, external solution, containing 70 μM Ca2+, was supplemented with 10 μM La3+. To estimate the load of the Ca2+-sensitive indicators, the cells were exposed to 2.5 μM of ionomycin at the end of each experiment. The fluorescence intensity (F) was normalized to the averaged fluorescence intensity before menthol application (F0). The plots show the time course of normalized fluorescence (F/F0) of fluo-4 (green traces) and rhod-2 (red traces). The galleries below the plots demonstrate the images of fluo-4 and rhod-2 fluorescence (as indicated) captured at the moments, depicted by the numbers on the plots, respectively. (C) Application of cold solution (21 °C) induces [Ca2+]c transients in keratinocytes bathed in Ca2+-free medium. (D) Bar diagram plot shows mean amplitudes of the fura-2 responses (fluorescence intensity ratio at 340 nm and 380 nm) to 100 µM menthol (n = 30), 10 µM icilin (n = 32), 0.1 µM WS-12 (n = 25), and mild cold (21 °C) (n = 20) in the cells bathed in Ca2+-free solution. (E) Changes in the ER luminal Ca2+ concentration [Ca2+]ER were monitored at 37 °C in digitonin-permeabilized keratinocytes, using the low-affinity Ca2+ indicator mag-fluo-4. Application of 10 µM icilin induces a gradual decrease of the normalized mag-fluo-4 fluorescence (F/F0) in control HaCaT cells (CTL HaCaT; C, Upper) but not in eTRPM8 KD HaCaT cells (shM8 HaCaT; C, Lower). To verify whether mag-fluo-4 response reflects the decrease of [Ca2+]ER, the ER was depleted at the end of the experiment by exposure of the cells to the solution containing 1 µM ionomycin and 10 µM EGTA. The traces on the graphs show the time course of the normalized mag-fluo-4 fluorescence (F/F0) averaged within outlined (red) regions. (F) Visualization of mitochondria with MitoTracker Green FM (MTG) confirms mitochondrial origin of rhod-2 response to stimulation of eTRPM8 with icilin in HaCaT cells. The plot shows the time course of self-normalized (F/F0) MTG and rhod-2 fluorescence, as indicated. The fluorescence intensity (F) was normalized to the averaged fluorescence intensity before icilin application (F0). The galleries below the plot demonstrate the images of MTG fluorescence (Top), rhod-2 fluorescence (Middle), and their overlay (Bottom): Every 12th image captured from a single HaCaT cell during the period, highlighted on the plot by a gray background, is shown (from left to right). Note that elevation of mitochondrial Ca2+ concentration ([Ca2+]m) is reported in the overlay images by change in color of mitochondria from green (dominating MTG fluorescence) to yellow (the overlay of MTG and elevated rhod-2 fluorescence).

