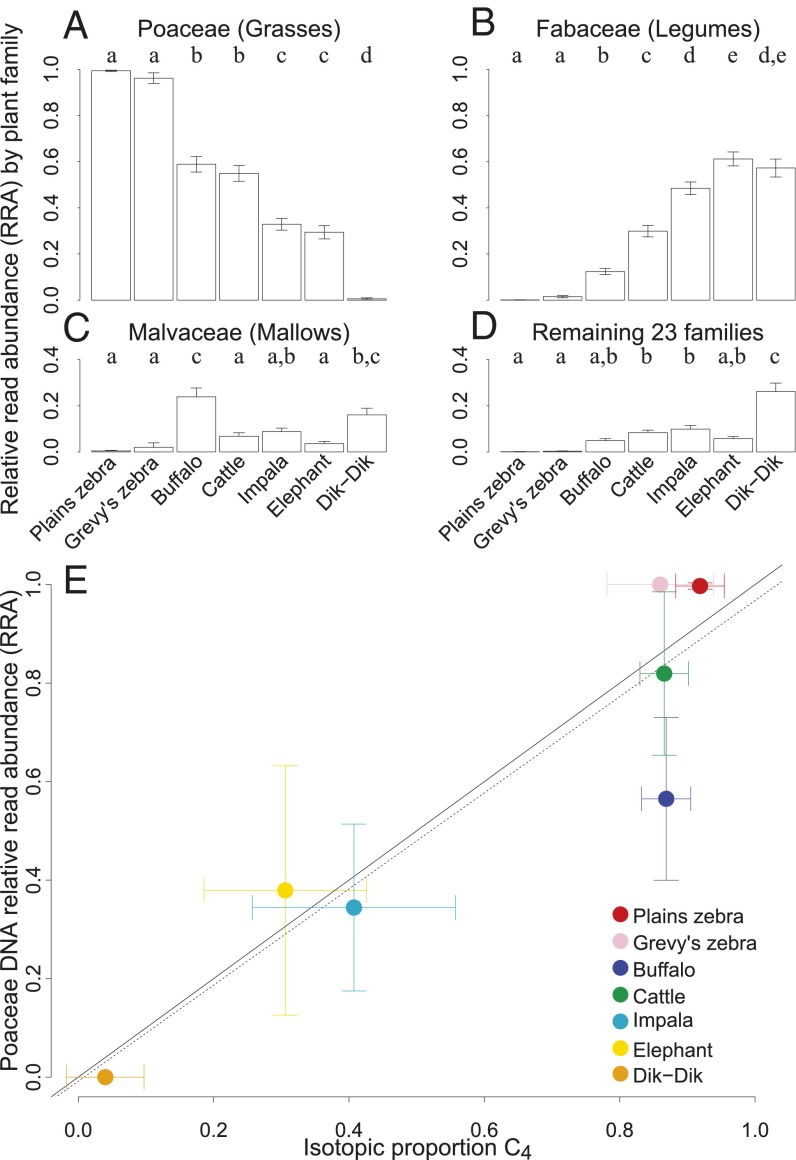
Fig. 2.
Mean RRA per sample for (A) Poaceae, (B) Fabaceae, (C) Malvaceae, and (D) all remaining plant families (±1 SEM) for each LMH species. Each comparison revealed significant differences (ANOVA, all F6,285 ≥ 14.1, P < 0.001). Letters above bars denote significant differences (Tukey's HSD). (E) Correlation of proportional C4 consumption estimated from stable isotopes vs. grass consumption estimated from mean RRA in a subset of samples from each species (mean ± SD). The trend line fit to the data (dashed; slope = 0.98, F1,5 = 27.9, R2 = 0.85 P < 0.01) nearly overlaps with the 1:1 line (solid).

