
Fig. 2.
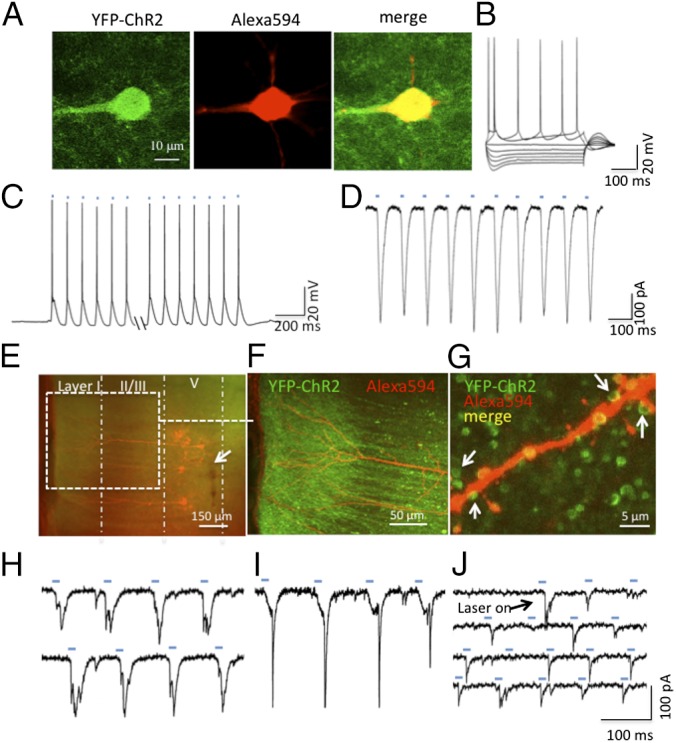
Electrophysiological validation of ChR2 activity in IL layer V pyramidal cells. (A) Two-photon image of a recorded ChR2-eYFP–expressing cell in layer V of IL (green fluorescence, Left), colabeling with neurobiotin/strepavidin-Alexa594 (red fluorescence, Middle), and merged image showing double labeling (Right). (B) Spikes induced in this cell by depolarizing pulses. (C) Whole-cell recordings showing spikes or (D) ChR2 slow-wave currents induced in this cell by laser pulses (15 ms, 10 Hz, marked by blue dashes). (E) A low-magnification (5×) fluorescence image in a PFC slice expressing ChR2-eYFP in the IL; a cloud of green fluorescence can be seen both in in the layer I (apical tuft) and in the layer V (cell body) region. Recorded cells are indicated by the presence of Alexa594-labeled cells; arrow shows track of injection needle. (F) Confocal image (20×) of the apical shaft and apical tuft of double-labeled recorded cells (expanded from area within white box in E). (G) High-magnification (100×) merged image shows punctate green ChR2-eYFP fluorescence surrounding an apical branch of a double-labeled recorded cell; arrows show green punctate labeling in close proximity to neurobiotin/Alexa594-labeled spines; these may represent collateral synaptic connections with nearby unlabeled cells. (H and I) Traces showing laser-induced EPSCs that are evoked in cells with discernable ChR2 slow-wave currents. (J) Example of a cell that does not have detectable ChR2 currents but in which laser stimulation evokes EPSCs; note the variable frequency and amplitude of EPSCs by light pulses (blue dashes). The EPSCs may be generated through axon collaterals of neighboring cells that do express ChR2-eYFP.