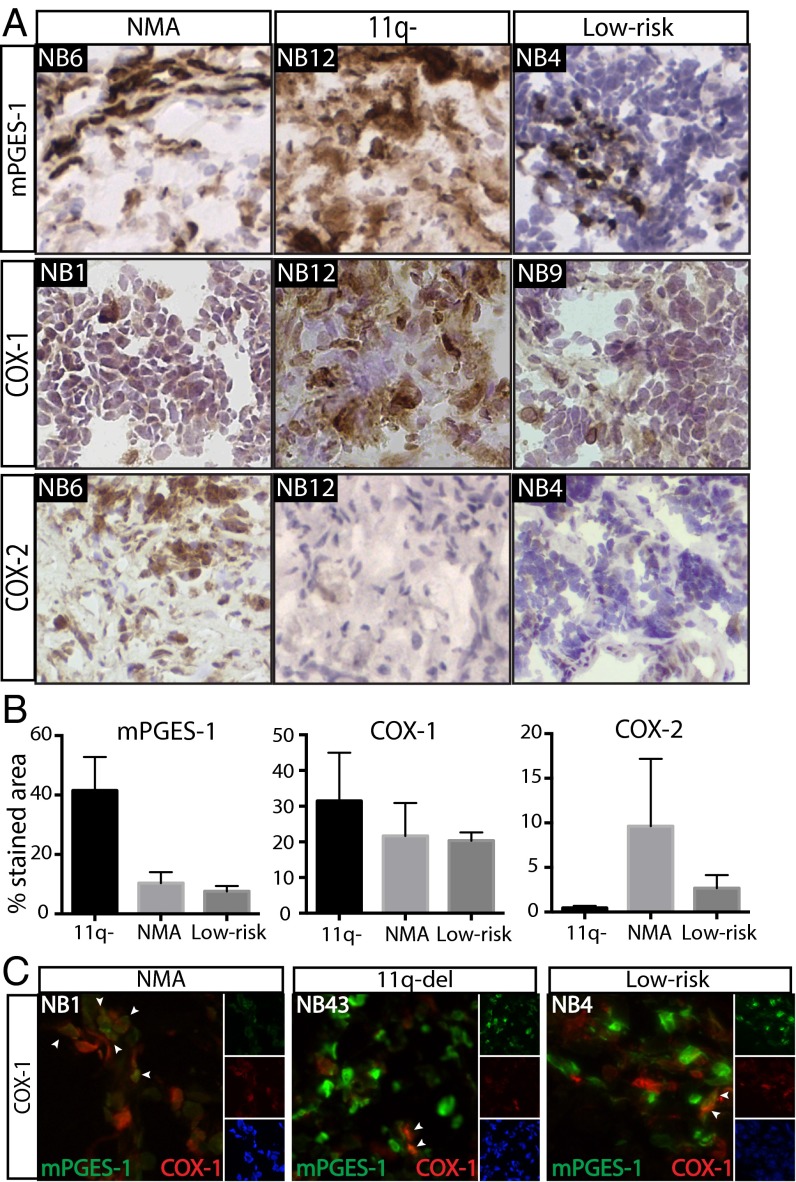
Fig. 2.
COX/mPGES-1 expression in human neuroblastoma tumors. (A) IHC analysis of mPGES-1, COX-1, and COX-2 in primary human neuroblastoma tumors with different biology: MYCN-amplification (NMA), 11q-deletion, and low-risk. Sections were counterstained with hematoxylin. One representative image was selected from tumors from at least three patients in each subgroup. (B) Quantification was performed on tumors from 11 patients in three clinical subgroups (four with 11q-deleted tumors, three with NMA tumors, and four with low-risk tumors). Data are presented as mean ± SEM. mPGES-1 expression was higher in 11q-deleted tumors than in low-risk tumors (P = 0.02), and there was a strong tendency toward higher mPGES-1 levels in 11q-deleted tumors compared with NMA tumors (P = 0.07). No differences in COX-1 or COX-2 levels were seen. (C) Dual labeling of mPGES-1 (green) and COX-1 (red) counterstained with a nuclear dye, Hoechst (blue). In the NB1 tumor, most cells expressing mPGES-1 also expressed COX-1. There also were cells expressing only COX-1. In the NB43 and NB4 tumors, cells expressed either COX-1 or mPGES-1 with only a few points of colocalization. Arrowheads indicate cells coexpressing both enzymes.

