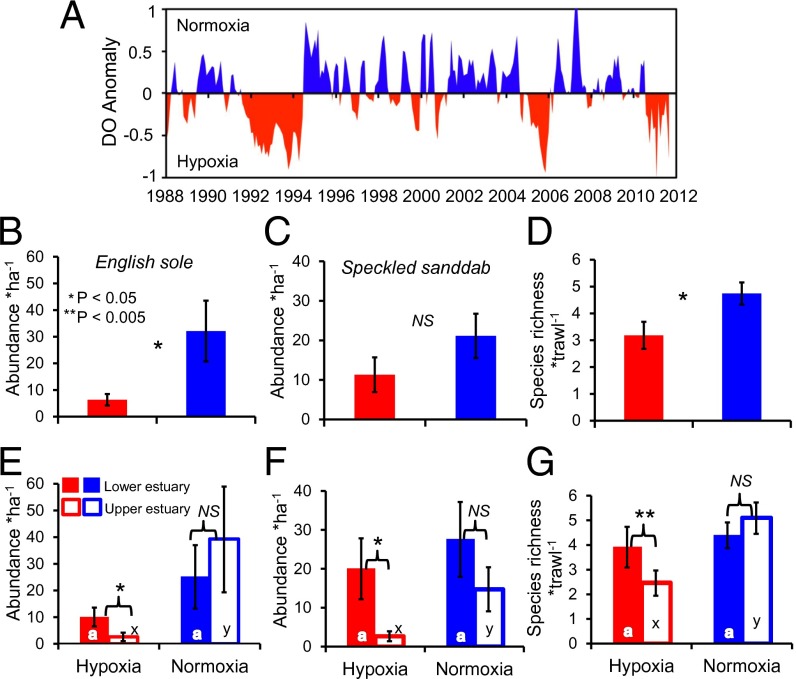
Fig. 2.
(A) Time series of the 3-mo moving average of the DOA (in milligrams per liter ± 0.38 SD). (B–D) Results from an independent-samples t tests comparing English sole and speckled sanddab abundance and fish species richness between hypoxic and normoxic periods using data from deep-channel survey data pooled from both the upper and lower estuary (see Table S3 for statistical results and sample sizes). (E–G) Results from both paired-samples t tests comparing differences in the lower and upper estuary on fish parameters during hypoxia and normoxia, respectively (see Table S3 for statistical results and sample sizes); and independent-samples t tests comparing the hypoxic and normoxic periods on fish parameters for both the lower and upper estuary, respectively (see Table S3 for statistical results and sample sizes). Differences in letters indicate significant differences (P < 0.10). All error bars represent ±1 SE.

