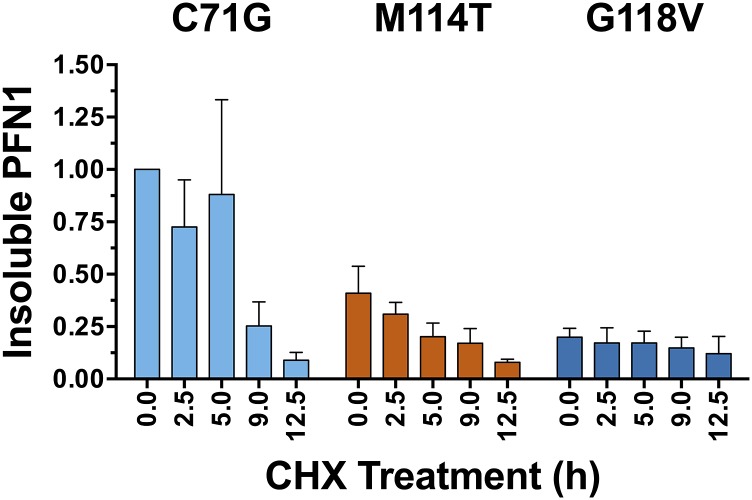
Fig. S3.
The turnover of insoluble PFN1 in SKNAS cells. The experiment was carried out as described in Fig. 2, and a representative Western blot analysis of the insoluble fraction is shown in Fig. 2B. The data above reflect the densitometry results from an average of n = 2 (M114T) or n = 3 (C71G and G118V) independent experiments and error bars represent SEM. Each sample was normalized to the PFN1 C71G band corresponding to “time 0.” The turnover of C71G within the insoluble fraction was slower relative to C71G within the soluble fraction (compare this graph to that in Fig. 2C). There was relatively less M114T and G118V in the insoluble fraction compared with C71G, and the small fraction of insoluble G118V persisted throughout the experimental time course.

