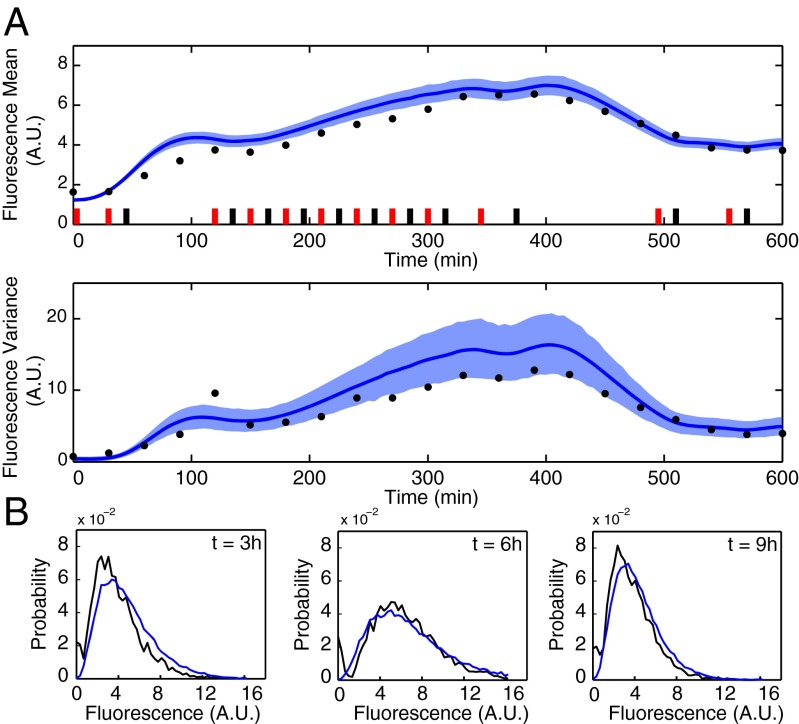
Fig. 3.
Validation of the identified model. (A) Measured and predicted (Upper) mean and (Lower) variance of the fluorescence distribution in a validation experiment. Model predictions are visualized in terms of the means (solid lines) and 98% confidence regions (shaded regions) of the posterior predictive distributions. (B) The measured fluorescence distributions (black) agree very well with simulated distributions (blue) obtained with the maximum a posteriori estimate .

