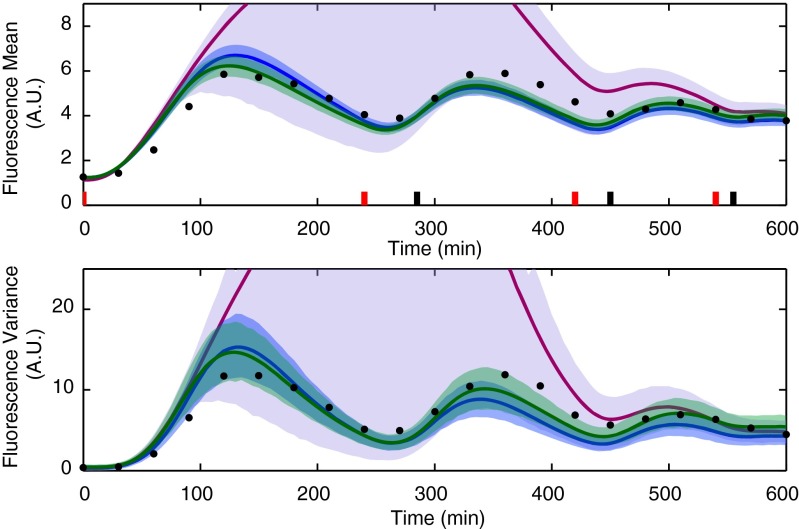
Fig. 4.
Comparison of the posterior predictive distributions computed using the parameter posterior distribution obtained from the two optimally designed (blue), the best pair of experience-based (green), and the two random (magenta) experiments for a second validation experiment. Model predictions are visualized in terms of the means (solid lines) and 98% confidence regions (shaded regions) of the posterior predictive distributions. The light sequence was chosen to produce damped oscillations of the mean fluorescence. The means and variances of the measured fluorescence distributions are shown with black dots.

