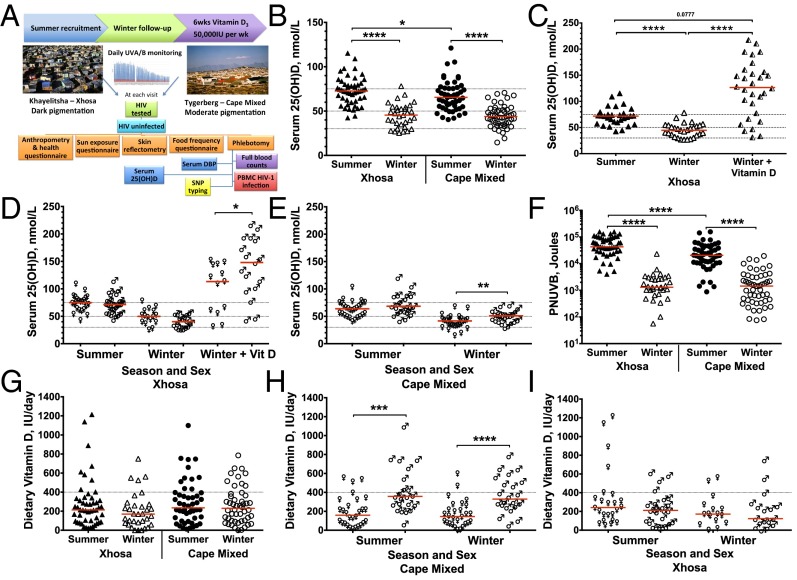
Fig. 1.
Vitamin D status, dietary vitamin D intake, and personal UVB exposure of Xhosa and Cape Mixed participants in Cape Town, South Africa, in summer, winter, and after receiving vitamin D3 in winter. (A) Study design. (B and C) Serum 25(OH)D concentration stratified by season (B) and after receiving vitamin D3 (C). Dotted lines indicate status thresholds: insufficiency, <75 nmol/L; deficiency, <50 nmol/L; severe deficiency, <30 nmol/L. (D and E) Serum 25(OH)D concentration stratified by sex (female, ♀; male, ♂) in Xhosa (D) and Cape Mixed (E) participants. (F) Dietary vitamin D intake measured by the food frequency questionnaire. Dotted lines indicate EAR. (G and H) Dietary vitamin D intake stratified by sex in Xhosa (G) and Cape Mixed (H) participants. (I) PNUVB. Xhosa: summer, n = 50; winter n = 33; winter + vitamin D, n = 30; Cape Mixed: summer and winter, n = 50. Medians are indicated by red lines. Significance was tested by the Wilcoxon rank test between seasons, by the Friedman test with Dunn’s multiple comparisons test for 25(OH)D postsupplementation (n = 30), and by the Mann–Whitney test between populations and sex; *P < 0.05; **P < 0.01; ***P < 0.001; ****P < 0.0001.

