Fig. 1.
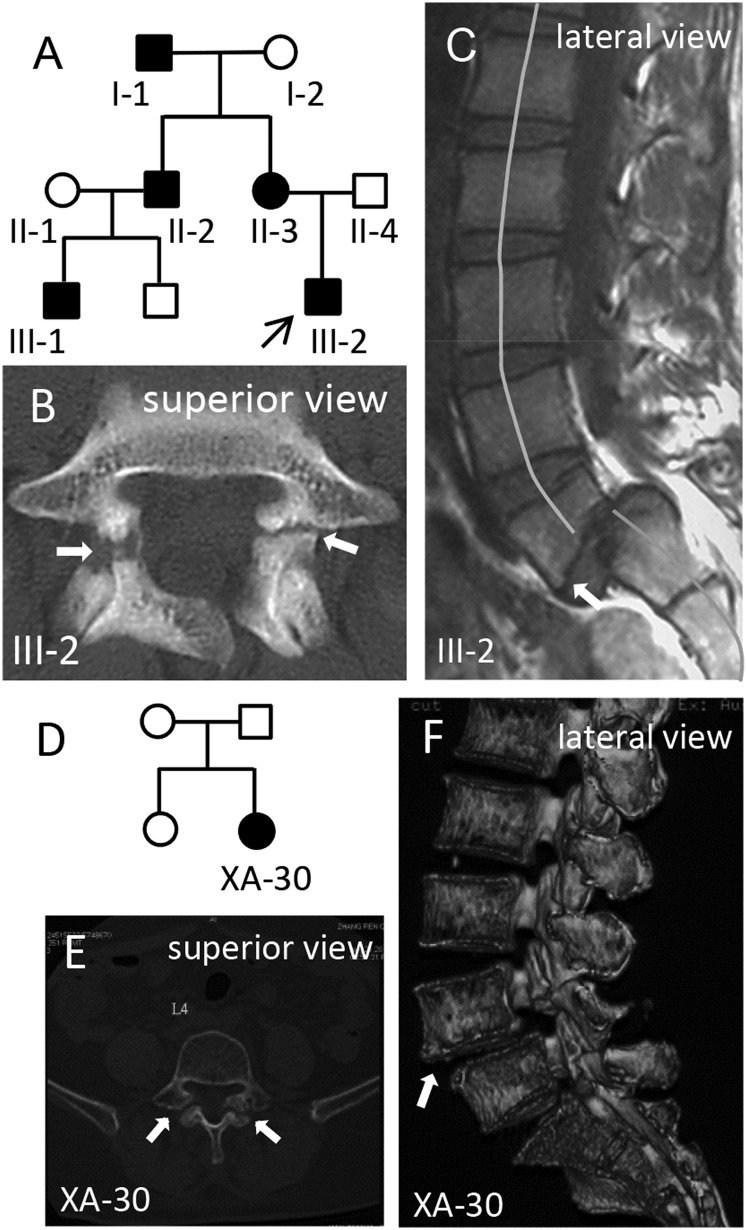
Pedigree and radiographic analysis. (A) Pedigree chart of a family with autosomal dominant spondylolysis. Filled symbols represent affected subjects. Squares signify male and circles, female. Arrow marks the proband. (B) Spinal CT scan of the proband III-2 shows bilateral spondylolysis (arrows) at the fifth lumbar vertebra (L5). (C) Lateral view of MRI shows grade-II spondylolisthesis of L5 (arrow) with spinal misalignment as well as hyperosteogeny. (D–F) An unrelated patient was diagnosed by CT (E) and 3D CT reconstruction (F) analysis with bilateral spondylolysis and grade-I spondylolisthesis of L4.

