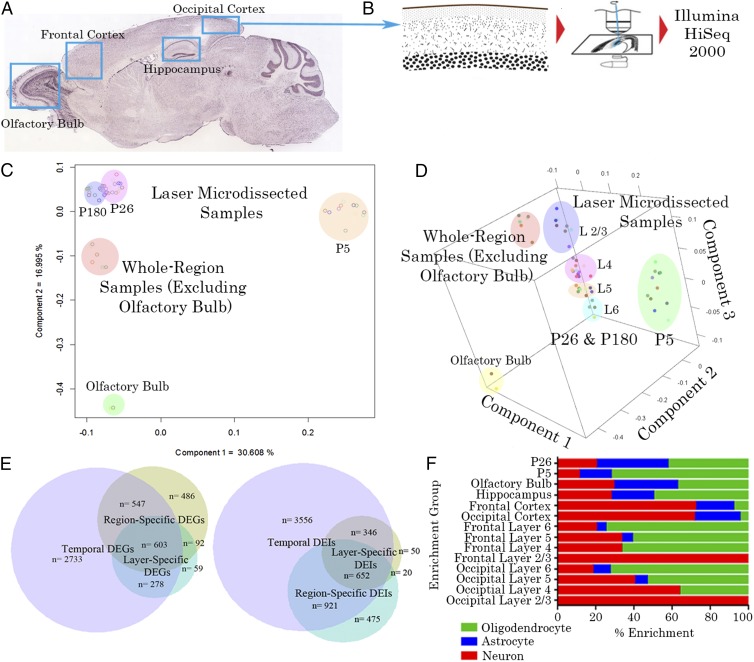
Fig. 1.
Region and layer-specific expression. (A) The brain regions sampled with bulk dissections (with coarse dots) and regions that were also microdissected (with fine dots). (B) In these areas, layers were isolated by laser microdissection. All sampled tissue was then converted to cDNA and sequenced on an Illumina HiSEq 2000 sequencer. (C) Two-dimensional plot of the two principal components of all samples, separating by age as well as layer- from region-dissected samples, where component 1 corresponds to age and component 2 corresponds to LMD versus whole-region dissections. (D) Three-dimensional principal component analysis (PCA) plot showing a third component (z axis) that divides LMD samples by cortical layer. (E) Venn diagram of genes differentially expressed across time, region, or cortical lamina. The majority of differentially expressed genes (DEGs) are differentially expressed across postnatal time points, with relatively few genes being uniquely differentially expressed across regions or layers. The majority of DEIs are differentially expressed across postnatal time points, but with a larger proportion of total isoforms differentially regulated either uniquely by age or in combination with layer and/or region. (F) Layer, region and age-specific enrichment for neuronal, astrocyte, and oligodendrocyte genes. Upper layers are particularly enriched in neuronal genes, with increasing contributions from astrocytes and oligodendrocytes through the deeper layers. Neuronal genes also dominate in the cortex whereas, in the hippocampus and olfactory bulb, there is a more equal distribution. Finally, the transcriptional profile at P5 is enriched in oligodendrocyte genes whereas, at P26, there is a greater proportion of astrocyte and neuronal genes. P180 is not shown because it was not particularly enriched in any cell-specific genes due to the overall similarity of gene expression to P26.

