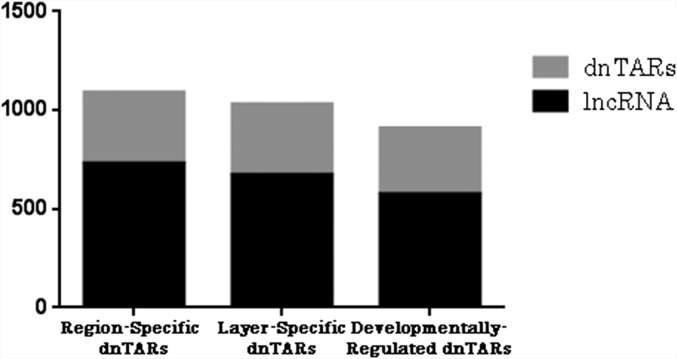
Fig. 2.
Breakdown of novel transcriptionally active regions (nTARs) by type. Three columns show nTARs that had differential expression across brain regions and cortical layers and over time, respectively. It can be seen that the majority of the nTARs in all columns are made up of long noncoding RNA (lncRNA).

