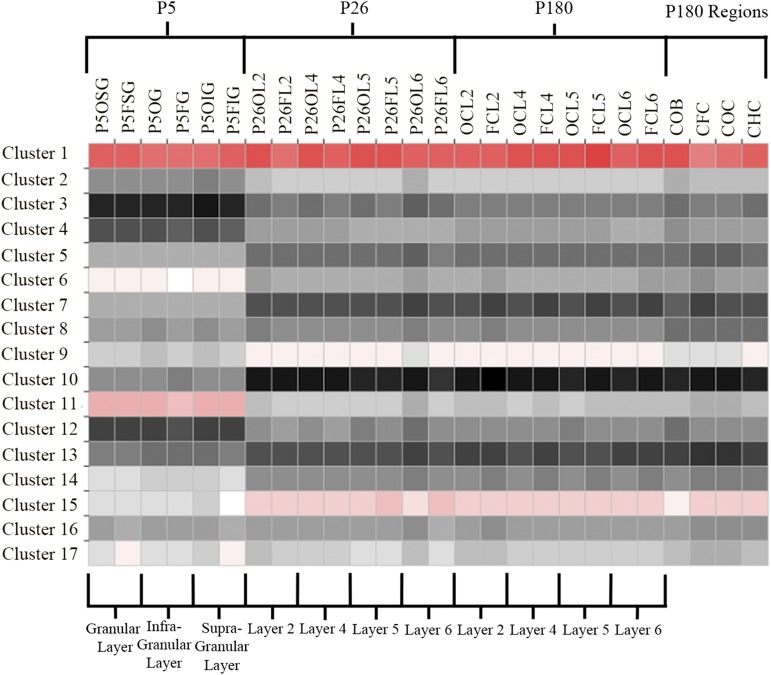
Fig. 3.
Weighted gene coexpression networks. Expression level of each cluster is indicated over each layer/region/age combination. Note that most of these clusters have unique expression patterns over time, region, layer, or a combination of these variables. Codes in column headings are named by age (P5, P26, or nil for P180), area (F, O, HC, and OB), and layer (SG, G, IG, or a number). See Table S18 for definitions of sample names.

