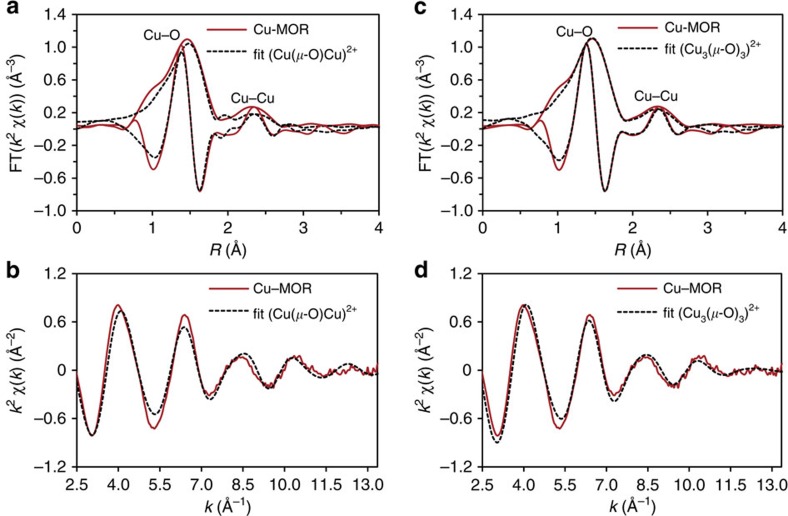
Figure 3. Copper EXAFS data and fitting for Cu-MOR.
Comparison of the k2-weighted Fourier transformed EXAFS at the Cu K-edge of the Cu-MOR zeolite activated in O2 at 450 °C with EXAFS simulation of an intrazeolite (a) binuclear [Cu(μ-O)Cu]2+, (c) trinuclear [Cu3(μ-O)3]2+ complexes and (b,d) the corresponding k2-weighted experimental EXAFS oscillations and their simulation using the DFT-computed model. Colour key: measured spectra (red lines), simulated spectra (black lines).

