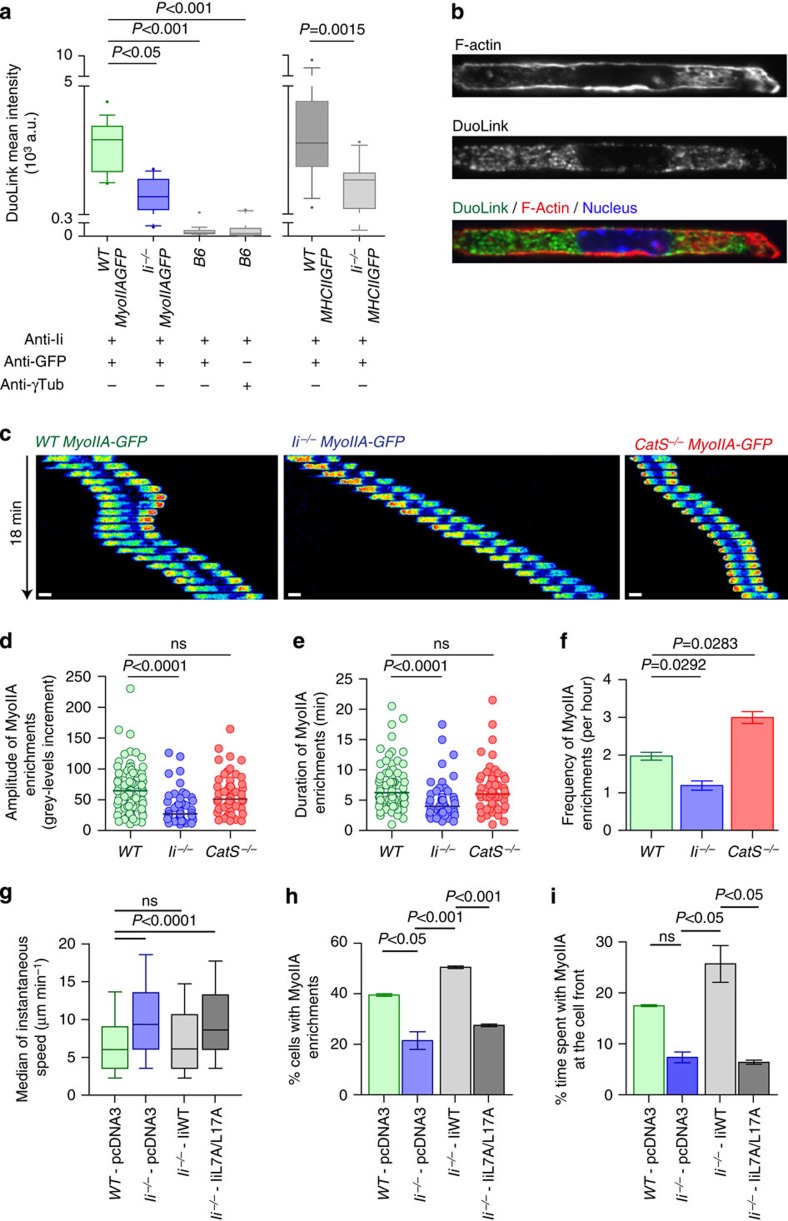
Figure 3. Myosin IIA enrichment at the DC front is promoted by Ii.
(a) Quantification of the Duo-Link signal mean fluorescence intensity on the entire cell using different DC types and antibody combinations, as indicated. Data are represented as box and whiskers (10–90 percentile) plus outliers. n=12–17 cells per condition from one representative experiment out of three. A Kruskal–Wallis and a Mann–Whitney test was applied for statistical analysis of left and right panels, respectively. (b) Spinning disk images (× 100, middle plane) of a fixed immature WT myosin IIA-GFP knock-in DC after PCR-based Duo-Link amplification using anti-Ii and anti-GFP antibodies. Scale bar, 5 μm. (c) Sequential epifluorescence pseudocolour images (× 20, one image every min), of representative myosin IIA-GFP knock-in WT, Ii−/− and CatS−/− DCs. Scale bars, 10 μm. (d) Amplitude (grey level increment) and (e) duration of myosin IIA enrichments in myosin IIA-GFP knock-in WT, Ii−/− and CatS−/− DCs (n=80, 48 and 55 cells, respectively, four independent experiments). Bars represent the medians. Littermate controls were used. A Kruskal–Wallis test was applied for statistical analysis. (f) Number of myosin IIA enrichments per hour, in myosin IIA-GFP knock-in WT, Ii−/− and CatS−/− DCs (n=224, 174 and 122 cells, respectively, from eight independent experiments). A paired t-test was applied for statistical analysis. (g) The median of instantaneous speed of WT or Ii−/− bone marrow DCs transfected on day 6 of differentiation with an empty vector (WT-pcDNA3), full-length human Ii (Ii−/−-IiWT) or human Ii whose leucines 7 and 17 were replaced by alanines (Ii−/−-IiL7AL17A). Data from three independent experiments are represented as box and whiskers (10–90 percentile). n=430 cells per condition. A Kruskal–Wallis test was applied for statistical analysis. (h) Percentage of DCs exhibiting at least one event of myosin IIA-GFP enrichment at their front during 1 h of recording and (i) percentage of time spent with myosin IIA-GFP at the front of myosin IIA-GFP knock-in DCs transfected as described in g. Data from two independent experiments are shown (n=53 WT-pcDNA3, 36 Ii−/−-pcDNA3, 55 Ii−/−-IiWT and 67 Ii−/−-IiL7AL17A cells). One-way analysis of variance (ANOVA) Bonferroni tests were applied for statistical analysis.

