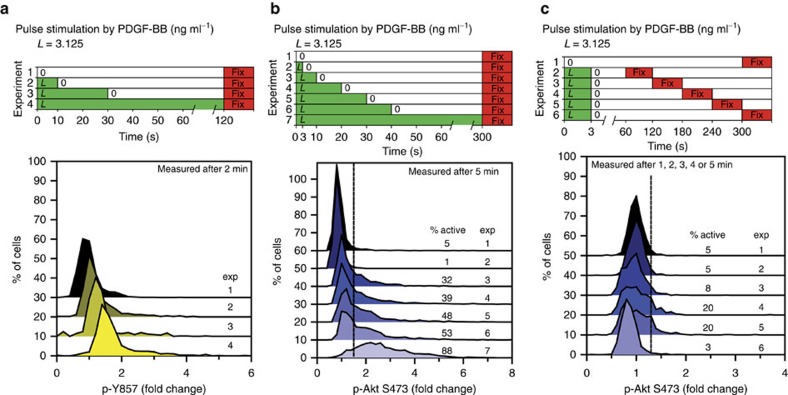
Figure 6. Pulse stimulation of NIH-3T3 fibroblasts by PDGF-BB (experimental stimulation schemes on the top, histograms on the bottom).
(a) PDGFR Y857 phosphorylation measured 2 min after stimulation (top-to-bottom) with 0 ng ml−1 PDGF-BB at t=0 s with no wash (exp 1, negative control), 3.125 ng ml−1 at t=0 s with wash at t=10 s (exp 2), 3.125 ng ml−1 at t=0 s with wash at t=30 s (exp 3), 3.125 ng ml−1 at t=0 s with no wash (exp 4, positive control). (b) Akt S473 phosphorylation measured 5 min after stimulation (top-to-bottom) with 0 ng ml−1 PDGF-BB at t=0 s with no wash (exp 1, negative control), 3.125 ng ml−1 at t=0 s with wash at t=3 s (exp 2), 3.125 ng ml−1 at t=0 s with wash at t=10 s (exp 3), 3.125 ng ml−1 at t=0 s with wash at t=20 s (exp 4), 3.125 ng ml−1 at t=0 s with wash at t=30 s (exp 5), 3.125 ng ml−1 at t=0 s with wash at t=40 s (exp 6) and 3.125 ng ml−1 at t=0 s with no wash (exp 7, positive control). (c) Akt S473 phosphorylation (top-to-bottom) measured 5 min after stimulation with 0 ng ml−1 PDGF-BB at t=0 s with no wash (exp 1, negative control), or 1 min (exp 2), 2 min (exp 3), 3 min (exp 4), 4 min (exp 5) or 5 min (exp 6) after stimulation with 3.125 ng ml−1 PDGF-BB at t=0 s with wash at t=3 s. The dotted vertical lines in b,c represent a threshold of Akt activation chosen such that the negative control (exp 1) has >95% of cells inactivated; the numbers under the '% active' headings indicate the percentages of cells observed to be above the threshold for each condition. Histogram distributions were generated from at least 3 different day replicates (representing a total of 332–2,501 cells per condition), and were offset vertically for comparison.

