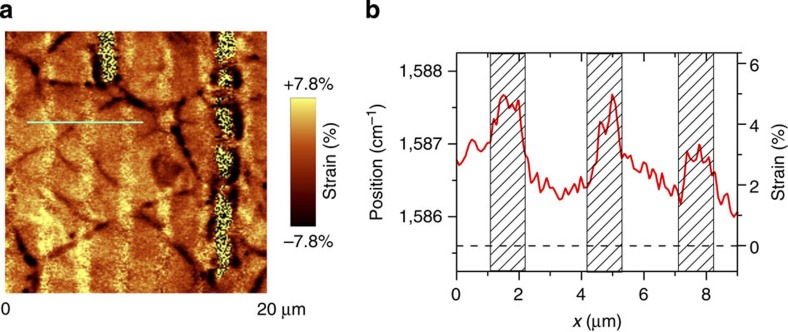
Figure 2. Spatial distribution of strain over the sample structure.
(a) Strain map of SLG on the Si/SiO2 grating. (b) Variation of G-band position and strain across the grating (blue line in a); shaded rectangles correspond to supported graphene; dashed line denotes the initial (unstrained) value of G-band position.

