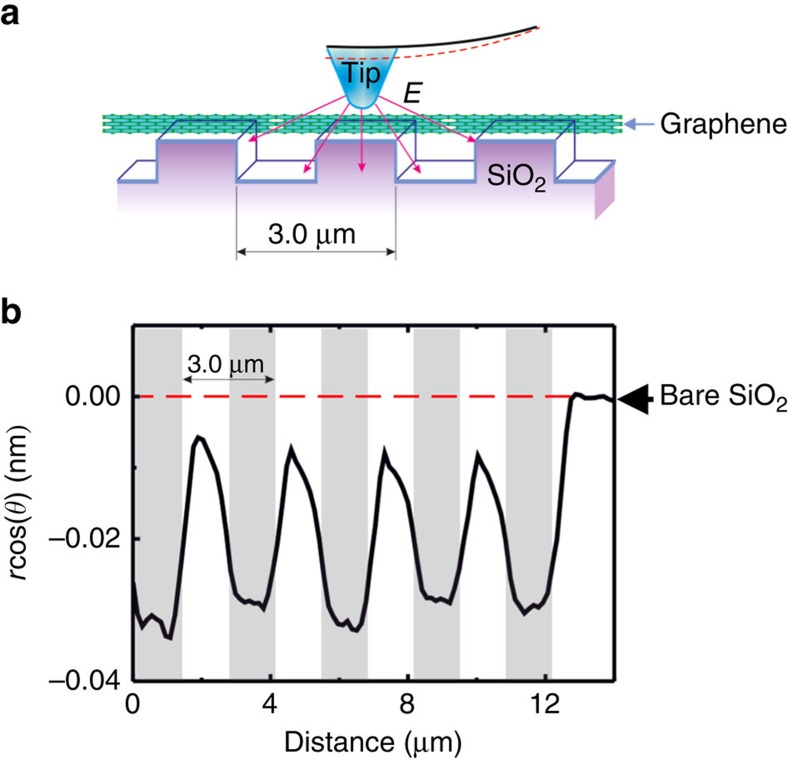
Figure 3. Spatial variation of piezoelectric response.
(a) Schematic of the PFM measurements on single-layer graphene adsorbed on the TGZ4 grating substrate. (b) Cross-section of the piezoresponse along the line on graphene across the grating structure (shaded areas correspond to supported graphene). The dashed red line denotes the baseline corresponding to the signal on the bare SiO2 substrate, which is shown as the tail at the right part of b. The measurements were carried out at 90 kHz (Va.c.=5 V). The PFM signal phase θ is 180° on graphene.

